
2025-01-29 20:09
الصناعة#ForexRiskTips
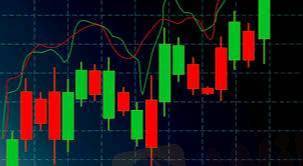
Using charts and indicators to plan trades helps traders make informed decisions by analyzing price movements, trends, and potential entry or exit points. Charts provide a visual representation of market behavior, allowing traders to identify patterns such as support and resistance levels, trendlines, and candlestick formations. Indicators like moving averages, RSI, MACD, and Fibonacci retracements help confirm trends, momentum, and potential reversals
إعجاب 0

FX2606123886
المتداول
مناقشة حية
الصناعة
NFP updates URDU
الصناعة
دوج كوين
الصناعة
دوجكوين
الصناعة
صعود الذهب
الصناعة
لقاحات كورونا
الصناعة
السيارات
فئة المنتدى

منصة

المعرض

الوكيل

التوظيف

استيراتيجية التداول التلقائي

الصناعة

السوق

المؤشر
#ForexRiskTips
كينيا | 2025-01-29 20:09Using charts and indicators to plan trades helps traders make informed decisions by analyzing price movements, trends, and potential entry or exit points. Charts provide a visual representation of market behavior, allowing traders to identify patterns such as support and resistance levels, trendlines, and candlestick formations. Indicators like moving averages, RSI, MACD, and Fibonacci retracements help confirm trends, momentum, and potential reversals
إعجاب 0
أريد أن اترك تعليق
تقديم
0تعليقات

لا توجد تعليقات حتى الآن ، كن أول شخص يعلق
تقديم
لا توجد تعليقات حتى الآن ، كن أول شخص يعلق