2020-04-18 15:24
Technischer IndexGOLD PRICE CHART - XAU/USD DAILY
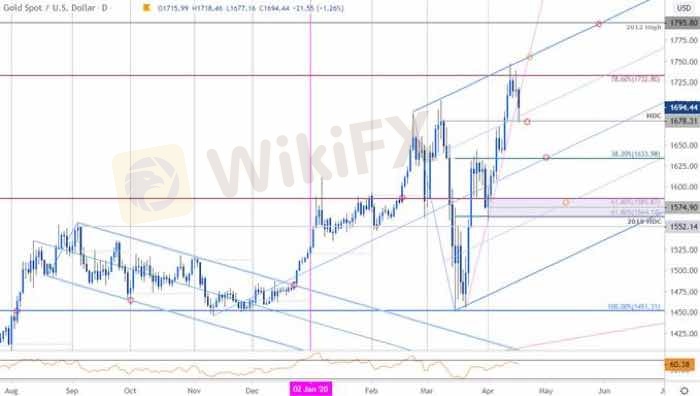
Technical Outlook: In my last Gold Price Outlook we noted that the XAU/USD rally was vulnerable heading into the close of March trade and that, “ultimately a larger pullback may offer more favorable entries with a breach of the highs needed to keep long-bias viable.” Price plummeted more than 5% to register a low at 1560 before ripping to fresh yearly highs into the April open.
The advance failed at slope resistance this week with price unable to mount a daily close above the 78.6% retracement of the decline from the record highs at 1733. Initial daily support rests at the March high-day close at 1678 backed by the median-line / 38.2% retracement of the yearly range at 1633- look for a larger reaction there If reached. Key support / bullish invalidation now rests at 1564/85.
Gefällt 0

TPKNX
Praktiker
Aktueller Inhalt
In der Industrie
Event-A comment a day,Keep rewards worthy up to$27
In der Industrie
Nigeria Event Giveaway-Win₦5000 Mobilephone Credit
In der Industrie
Nigeria Event Giveaway-Win ₦2500 MobilePhoneCredit
In der Industrie
South Africa Event-Come&Win 240ZAR Phone Credit
In der Industrie
Nigeria Event-Discuss Forex&Win2500NGN PhoneCredit
In der Industrie
[Nigeria Event]Discuss&win 2500 Naira Phone Credit
Kategorie

Plattform

Ausstellung

IB

Rekrutierung

EA

In der Industrie

Markt

Index


Einreichen
Es gibt noch keinen Kommentar. Mach den ersten