
2020-05-06 09:47
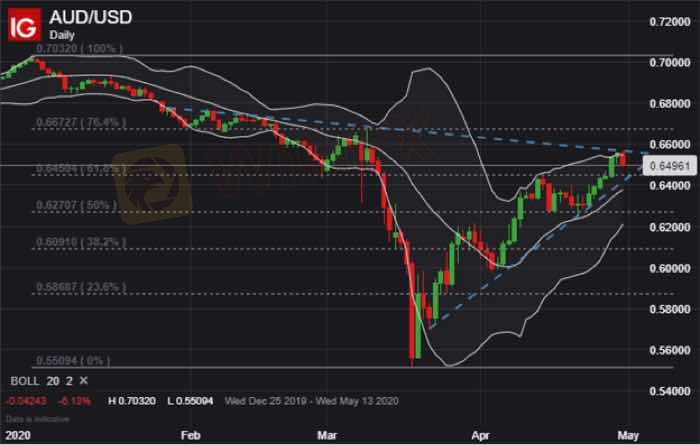
Technischer IndexAUD/USD PRICE CHART: DAILY TIME FRAME (DECEMBER 20
Zooming in on a daily AUD/USD chart shows the Australian Dollar is already starting to edge lower with a bearish reaction to its upper Bollinger Band near the 0.6500 price level. Technical support, underpinned by the 61.8% Fibonacci retracement of its year-to-date trading range, may provide AUD/USD a degree of buoyancy. Although, Australian Dollar selling pressure could accelerate if spot AUD/USD price action invalidates its short-term bullish trend noted by the recent series of higher lows.
Gefällt 1

TPKNX
المشاركين
Aktueller Inhalt
In der Industrie
Demo-Handelsaufzeichnungen teilen
In der Industrie
Demo-Handelsaufzeichnungen teilen
In der Industrie
Demo-Handelsaufzeichnungen teilen
In der Industrie
Demo-Handelsaufzeichnungen teilen
In der Industrie
Demo-Handelsaufzeichnungen teilen
Kategorie

Plattform

Ausstellung

IB

Rekrutierung

EA

In der Industrie

Markt

Index
AUD/USD PRICE CHART: DAILY TIME FRAME (DECEMBER 20
Vereinigte Staaten | 2020-05-06 09:47Gefällt 1
Ich möchte auch kommentieren
Einreichen
0Kommentare

Es gibt noch keinen Kommentar. Mach den ersten
Einreichen
Es gibt noch keinen Kommentar. Mach den ersten