2024-11-09 07:31
In der IndustrieEuro Technical Analysis – EUR/USD Daily Chart
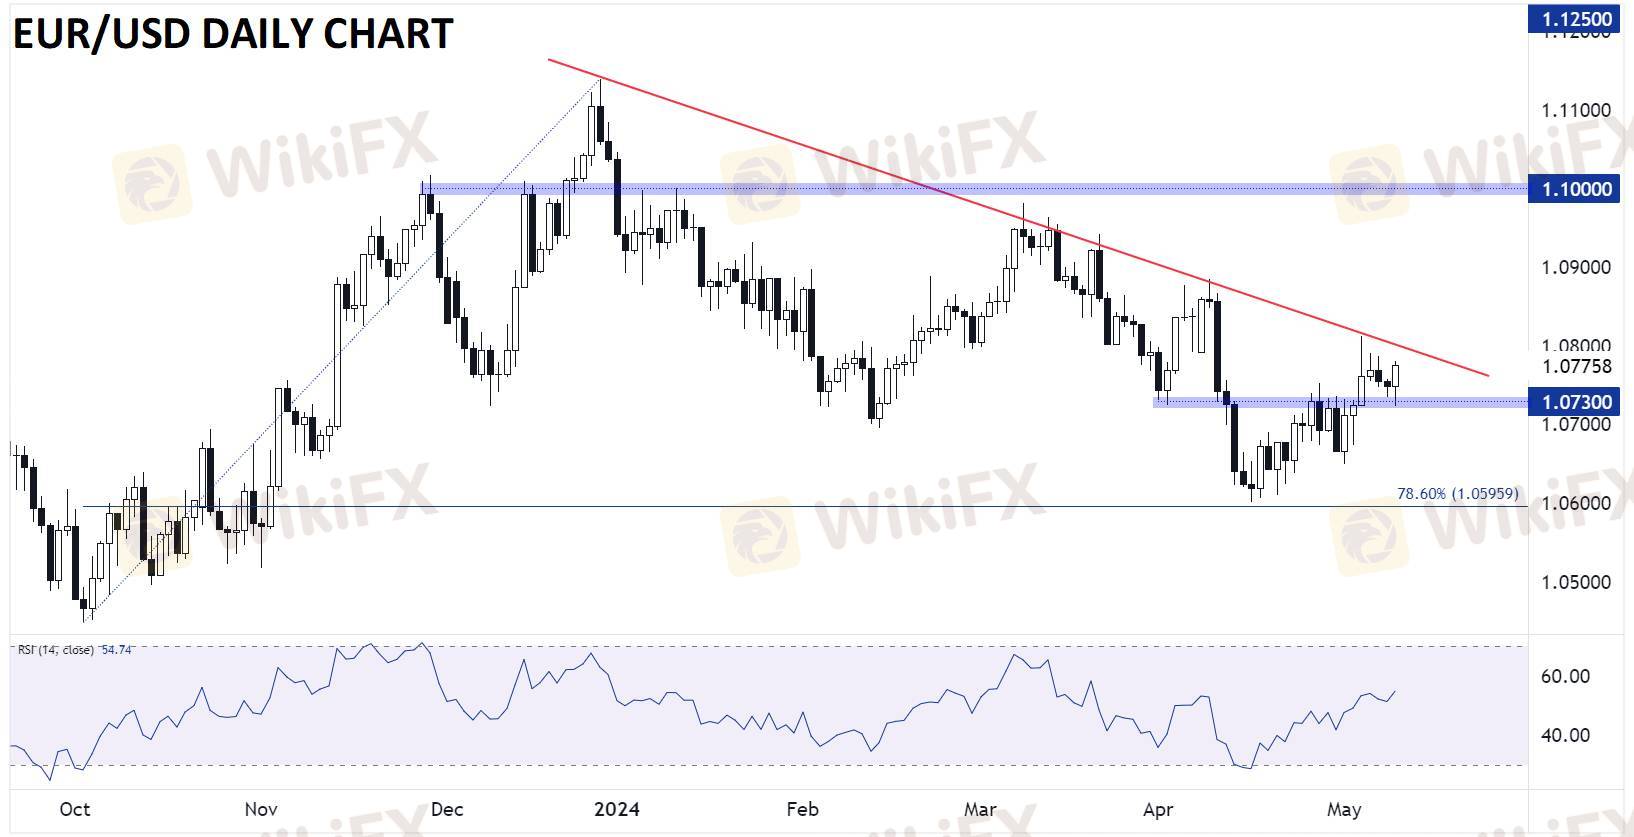
Looking first at the chart of EUR/USD, the pair remains in a medium-term downtrend of its December high near 1.1100. From a shorter-term perspective, the pair is forming a Bullish Engulfing Candle off 1.0730 today’s price action; for the uninitiated, a Bullish Engulfing candle is formed when the candle breaks below the low of the previous time period before buyers step in and push rates up to close above the high of the previous time period. It indicates that the buyers have wrested control of the market from the sellers and shows potential for more upside in the coming days.
To the topside, the resistance area to watch comes from the 5-month bearish trend line near 1.0800, with bulls looking for a confirmed break above that zone before growing more constructive on the pair. A break below previous support/resistance at 1.0730 would flip the near-term bias back in favor of the bears heading into next week.
Gefällt 0

CSK
Händler
Aktueller Inhalt
In der Industrie
Event-A comment a day,Keep rewards worthy up to$27
In der Industrie
Nigeria Event Giveaway-Win₦5000 Mobilephone Credit
In der Industrie
Nigeria Event Giveaway-Win ₦2500 MobilePhoneCredit
In der Industrie
South Africa Event-Come&Win 240ZAR Phone Credit
In der Industrie
Nigeria Event-Discuss Forex&Win2500NGN PhoneCredit
In der Industrie
[Nigeria Event]Discuss&win 2500 Naira Phone Credit
Kategorie

Plattform

Ausstellung

IB

Rekrutierung

EA

In der Industrie

Markt

Index
Euro Technical Analysis – EUR/USD Daily Chart
 | 2024-11-09 07:31
Looking first at the chart of EUR/USD, the pair remains in a medium-term downtrend of its December high near 1.1100. From a shorter-term perspective, the pair is forming a Bullish Engulfing Candle off 1.0730 today’s price action; for the uninitiated, a Bullish Engulfing candle is formed when the candle breaks below the low of the previous time period before buyers step in and push rates up to close above the high of the previous time period. It indicates that the buyers have wrested control of the market from the sellers and shows potential for more upside in the coming days.
To the topside, the resistance area to watch comes from the 5-month bearish trend line near 1.0800, with bulls looking for a confirmed break above that zone before growing more constructive on the pair. A break below previous support/resistance at 1.0730 would flip the near-term bias back in favor of the bears heading into next week.
Gefällt 0
Ich möchte auch kommentieren
Einreichen
0Kommentare

Es gibt noch keinen Kommentar. Mach den ersten


Einreichen
Es gibt noch keinen Kommentar. Mach den ersten