
2025-01-29 02:16
In der IndustrieCandlestick trading
#firstdealofthenewyearchewbacca#
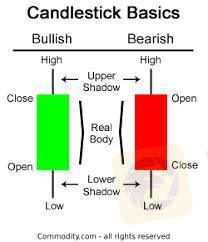
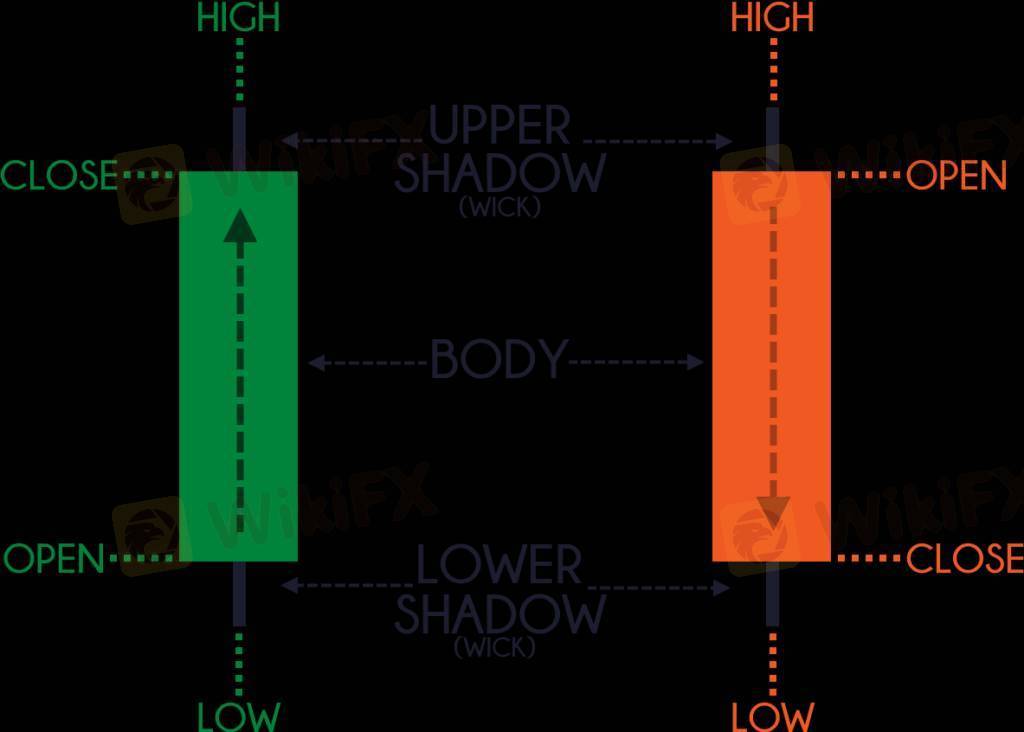
Candlestick trading is a popular method of analyzing and predicting market price movements in financial markets such as stocks, forex, and cryptocurrencies. It uses candlestick charts, which visually represent price data over a specific time frame. Each candlestick provides four key pieces of information:
1. Open: The price at which the asset started trading during the time period.
2. High: The highest price reached during the time period.
3. Low: The lowest price reached during the time period.
4. Close: The price at which the asset ended trading during the time period.
Components of a Candlestick
Body: The rectangular part of the candlestick represents the difference between the opening and closing prices.
Bullish Candle: If the closing price is higher than the opening price, the candle is typically green or white.
Bearish Candle: If the closing price is lower than the opening price, the candle is typically red or black.
Wicks/Shadows: The thin lines above and below the body show the high and low prices during the time period.
Common Candlestick Patterns
Candlestick patterns are categorized into reversal patterns and continuation patterns. Here are a few examples:
Reversal Patterns
1. Hammer: A small body near the top with a long lower wick, signaling potential bullish reversal.
2. Shooting Star: A small body near the bottom with a long upper wick, signaling potential bearish reversal.
3. Engulfing Pattern:
Bullish Engulfing: A small red candle followed by a larger green candle that "engulfs" the previous one.
Bearish Engulfing: A small green candle followed by a larger red candle that "engulfs" the previous one.
Continuation Patterns
1. Doji: A candle where the open and close prices are nearly the same, indicating indecision in the market.
2. Morning Star: A three-candle pattern signaling a bullish continuation.
3. Evening Star: A three-candle pattern signaling a bearish continuation.
Advantages of Candlestick Trading
Easy to read and interpret visually.
Provides insights into market sentiment.
Works well with other technical indicators (e.g., moving averages, RSI).
Limitations
Requires practice to interpret correctly.
Patterns may not always predict price movement accurately.
Works best when combined with other tools and analysis methods.
Gefällt 0

FX1816125491
Händler
Aktueller Inhalt
In der Industrie
Event-A comment a day,Keep rewards worthy up to$27
In der Industrie
Nigeria Event Giveaway-Win₦5000 Mobilephone Credit
In der Industrie
Nigeria Event Giveaway-Win ₦2500 MobilePhoneCredit
In der Industrie
South Africa Event-Come&Win 240ZAR Phone Credit
In der Industrie
Nigeria Event-Discuss Forex&Win2500NGN PhoneCredit
In der Industrie
[Nigeria Event]Discuss&win 2500 Naira Phone Credit
Kategorie

Plattform

Ausstellung

IB

Rekrutierung

EA

In der Industrie

Markt

Index
Candlestick trading
Nigeria | 2025-01-29 02:16#firstdealofthenewyearchewbacca#
Candlestick trading is a popular method of analyzing and predicting market price movements in financial markets such as stocks, forex, and cryptocurrencies. It uses candlestick charts, which visually represent price data over a specific time frame. Each candlestick provides four key pieces of information:
1. Open: The price at which the asset started trading during the time period.
2. High: The highest price reached during the time period.
3. Low: The lowest price reached during the time period.
4. Close: The price at which the asset ended trading during the time period.
Components of a Candlestick
Body: The rectangular part of the candlestick represents the difference between the opening and closing prices.
Bullish Candle: If the closing price is higher than the opening price, the candle is typically green or white.
Bearish Candle: If the closing price is lower than the opening price, the candle is typically red or black.
Wicks/Shadows: The thin lines above and below the body show the high and low prices during the time period.
Common Candlestick Patterns
Candlestick patterns are categorized into reversal patterns and continuation patterns. Here are a few examples:
Reversal Patterns
1. Hammer: A small body near the top with a long lower wick, signaling potential bullish reversal.
2. Shooting Star: A small body near the bottom with a long upper wick, signaling potential bearish reversal.
3. Engulfing Pattern:
Bullish Engulfing: A small red candle followed by a larger green candle that "engulfs" the previous one.
Bearish Engulfing: A small green candle followed by a larger red candle that "engulfs" the previous one.
Continuation Patterns
1. Doji: A candle where the open and close prices are nearly the same, indicating indecision in the market.
2. Morning Star: A three-candle pattern signaling a bullish continuation.
3. Evening Star: A three-candle pattern signaling a bearish continuation.
Advantages of Candlestick Trading
Easy to read and interpret visually.
Provides insights into market sentiment.
Works well with other technical indicators (e.g., moving averages, RSI).
Limitations
Requires practice to interpret correctly.
Patterns may not always predict price movement accurately.
Works best when combined with other tools and analysis methods.
Gefällt 0
Ich möchte auch kommentieren
Einreichen
0Kommentare

Es gibt noch keinen Kommentar. Mach den ersten
Einreichen
Es gibt noch keinen Kommentar. Mach den ersten