2025-02-12 16:18
In der IndustrieTechnical Analysis in Forex: Trends and Patterns.
#Firstdealofthenewyearastylz
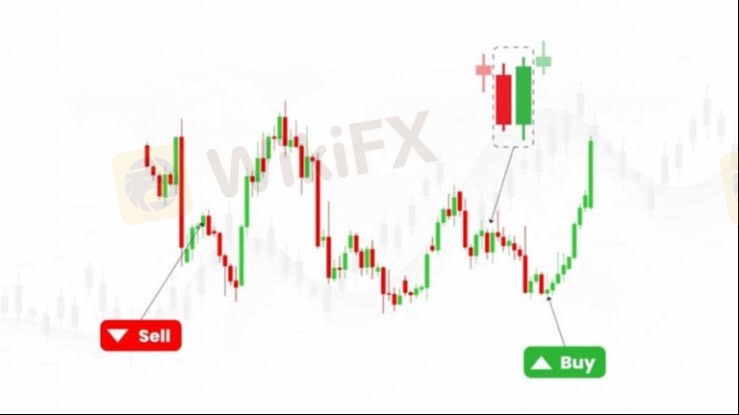
Technica l analysis in forex trading involves analyzing past price movements using charts and indicators to predict future price behavior. Traders use various tools to identify trends and patterns that can help them make informed trading decisions.
1. Understanding Trends in Forex
A trend is the general direction in which the market is moving. Trends are classified into three types:
A. Types of Trends
1. Uptrend (Bullish Market) – Prices make higher highs and higher lows.
2. Downtrend (Bearish Market) – Prices make lower highs and lower lows.
3. Sideways Trend (Range-Bound Market) – Prices move within a horizontal range.
B. Trendlines
• A trendline is a straight line drawn on a chart to connect price points.
• Uptrend Line: Drawn along support levels.
• Downtrend Line: Drawn along resistance levels.
C. Moving Averages
• Moving Averages help smooth price fluctuations to identify trends.
• Simple Moving Average (SMA) – Average of closing prices over a period.
• Exponential Moving Average (EMA) – Gives more weight to recent prices.
2. Chart Patterns in Forex
Chart patterns are formations created by price movements that signal future price action. They are classified into continuation patterns and reversal patterns.
A. Continuation Patterns (Trend Will Continue)
1. Flags and Pennants – Small consolidations before a trend resumes.
2. Triangles
• Ascending Triangle (Bullish)
• Descending Triangle (Bearish)
• Symmetrical Triangle (Breakout in either direction)
3. Rectangles (Range Bound) – Price consolidates within parallel support and resistance levels.
B. Reversal Patterns (Trend Will Change Direction)
1. Head and Shoulders – Indicates a trend reversal.
2. Double Top and Double Bottom – Signals reversal after two failed attempts to break a level.
3. Cup and Handle – A bullish continuation pattern.
3. Candlestick Patterns
Candlestick patterns provide insight into market sentiment.
A. Bullish Candlestick Patterns
1. Hammer – Indicates a potential reversal after a downtrend.
2. Bullish Engulfing – A strong bullish signal.
3. Morning Star – A three-candle pattern showing reversal.
B. Bearish Candlestick Patterns
1. Shooting Star – A sign of a potential downtrend.
2. Bearish Engulfing – A strong bearish signal.
3. Evening Star – A three-candle pattern indicating a trend reversal.
4. Indicators to Confirm Trends and Patterns
1. Relative Strength Index (RSI) – Measures market momentum (overbought/oversold conditions).
2. Moving Average Convergence Divergence (MACD) – Identifies trend changes.
3. Bollinger Bands – Measures market volatility.
Conclusion
Technical analysis helps forex traders understand market trends and price patterns to make better trading decisions. By combining trend analysis, chart patterns, and technical indicators, traders can enhance their strategy and improve their chances of success in the forex market.
Gefällt 0
FX1335868550
Händler
Aktueller Inhalt
In der Industrie
Event-A comment a day,Keep rewards worthy up to$27
In der Industrie
Nigeria Event Giveaway-Win₦5000 Mobilephone Credit
In der Industrie
Nigeria Event Giveaway-Win ₦2500 MobilePhoneCredit
In der Industrie
South Africa Event-Come&Win 240ZAR Phone Credit
In der Industrie
Nigeria Event-Discuss Forex&Win2500NGN PhoneCredit
In der Industrie
[Nigeria Event]Discuss&win 2500 Naira Phone Credit
Kategorie

Plattform

Ausstellung

IB

Rekrutierung

EA

In der Industrie

Markt

Index
Technical Analysis in Forex: Trends and Patterns.
 Nigeria | 2025-02-12 16:18
 #Firstdealofthenewyearastylz
Technica l analysis in forex trading involves analyzing past price movements using charts and indicators to predict future price behavior. Traders use various tools to identify trends and patterns that can help them make informed trading decisions.
1. Understanding Trends in Forex
A trend is the general direction in which the market is moving. Trends are classified into three types:
A. Types of Trends
1. Uptrend (Bullish Market) – Prices make higher highs and higher lows.
2. Downtrend (Bearish Market) – Prices make lower highs and lower lows.
3. Sideways Trend (Range-Bound Market) – Prices move within a horizontal range.
B. Trendlines
• A trendline is a straight line drawn on a chart to connect price points.
• Uptrend Line: Drawn along support levels.
• Downtrend Line: Drawn along resistance levels.
C. Moving Averages
• Moving Averages help smooth price fluctuations to identify trends.
• Simple Moving Average (SMA) – Average of closing prices over a period.
• Exponential Moving Average (EMA) – Gives more weight to recent prices.
2. Chart Patterns in Forex
Chart patterns are formations created by price movements that signal future price action. They are classified into continuation patterns and reversal patterns.
A. Continuation Patterns (Trend Will Continue)
1. Flags and Pennants – Small consolidations before a trend resumes.
2. Triangles
• Ascending Triangle (Bullish)
• Descending Triangle (Bearish)
• Symmetrical Triangle (Breakout in either direction)
3. Rectangles (Range Bound) – Price consolidates within parallel support and resistance levels.
B. Reversal Patterns (Trend Will Change Direction)
1. Head and Shoulders – Indicates a trend reversal.
2. Double Top and Double Bottom – Signals reversal after two failed attempts to break a level.
3. Cup and Handle – A bullish continuation pattern.
3. Candlestick Patterns
Candlestick patterns provide insight into market sentiment.
A. Bullish Candlestick Patterns
1. Hammer – Indicates a potential reversal after a downtrend.
2. Bullish Engulfing – A strong bullish signal.
3. Morning Star – A three-candle pattern showing reversal.
B. Bearish Candlestick Patterns
1. Shooting Star – A sign of a potential downtrend.
2. Bearish Engulfing – A strong bearish signal.
3. Evening Star – A three-candle pattern indicating a trend reversal.
4. Indicators to Confirm Trends and Patterns
1. Relative Strength Index (RSI) – Measures market momentum (overbought/oversold conditions).
2. Moving Average Convergence Divergence (MACD) – Identifies trend changes.
3. Bollinger Bands – Measures market volatility.
Conclusion
Technical analysis helps forex traders understand market trends and price patterns to make better trading decisions. By combining trend analysis, chart patterns, and technical indicators, traders can enhance their strategy and improve their chances of success in the forex market.
Gefällt 0
Ich möchte auch kommentieren
Einreichen
0Kommentare

Es gibt noch keinen Kommentar. Mach den ersten

Einreichen
Es gibt noch keinen Kommentar. Mach den ersten