GBP/USD. Analysis for the trading week of March 13–17 (COT report)
Zusammenfassung:When trading GBPUSD, the British pound is called the base currency and the US dollar is called the terms currency. The quote of the currency pair shows the number of US dollars needed to buy one British pound.


When trading GBPUSD, the British pound is called the base currency and the US dollar is called the terms currency. The quote of the currency pair shows the number of US dollars needed to buy one British pound.
Long-term outlook.
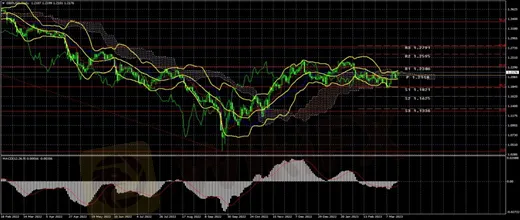
The GBP/USD currency pair has continued to rise this week after breaking through the lower boundary of the 1.1840-1.2440 side channel. Some local movements can be seen inside the side channel, but the most important thing is that the flat remains. However, if the flat holds, we can't anticipate any trend changes. Currently, the pair can comfortably go to the level of 1.2440, regardless of the fundamental and macroeconomic backgrounds. For the pound and the dollar this week, there weren't many truly significant developments.
Even reports that appeared to be significant at first glance turned out to be unimportant. We are discussing British statistics, which included information on wages and unemployment. The fact that no other data has been disclosed in the UK should be mentioned immediately. There were quite a few secondary publications in the United States, but the inflation report for February naturally took first place. Its value did not disappoint investors, but because it came as close as feasible to the prediction, there was little to no reaction.
An inflation report is still a significant event, though. Its value of 6% in February, for instance, indicates that the speed of the slowdown has accelerated again, indicating that the Fed is on the correct track and that further tightening of monetary policy (or a faster pace of rate hikes) is not yet necessary. This is bad news for the US currency, given that the Fed meeting will take place next week and the prospects of a 0.5% rate hike are now nearly zero.
This shouldn't come as a surprise considering that the only way to raise the rate since the last Fed meeting was by 0.25%. When Jerome Powell allowed for more tightening during his statement to Congress, he confused the market. The likelihood of a rate increase of half a percent, however, has been eliminated due to recent developments in America, including bank failures and a good drop in inflation.
COT evaluation.
While the CFTC keeps up with the schedule, COT reports for the British pound continue to come out with a significant delay. The most recent report available is from March 7. The non-commercial group has opened 7.5 thousand buy contracts and 1.2 thousand sell contracts, according to this data. As a result, non-commercial traders' net position has increased by 6.3 thousand and is still growing. The net position indicator has been rising consistently over the past six months, but the major players' outlook is still “bearish,” and even though the pound sterling is strengthening versus the dollar (in the longer term), it is quite challenging to determine the basic reasons why. We do not rule out the possibility that the pound may start to decline more rapidly in the near future. As the pound has not increased in three months, it has officially started, but thus far the trend appears to be more flat.
Note that both major pairs are currently moving quite similarly, but that the net position on the euro is positive and even suggests that the upward momentum will soon come to an end, while the net position on the pound is negative, allowing us to predict further growth. Yet, the pound has already increased by 2,100 points, which is a significant amount, and without a significant downward correction, further growth would be completely nonsensical. A total of 66 thousand sales contracts and 49 thousand purchase contracts have now been opened by the non-commercial group. We continue to be pessimistic about the British pound's long-term growth and anticipate a decline.
Analysis of important events.
This week in the UK, there was essentially nothing interesting. The failure of three American banks and the subsequent appearance of issues at Swiss Credit Suisse has given the market the wrong impression for the entire week. As a result, practically all of this week's strong movements were caused by this news, rather than macroeconomic data. The ECB meeting received no attention from the market, let alone less significant events. The following week ought to be more exciting, though. Just a weak industrial output report, a weak report on retail sales, and a weak consumer mood index from the University of Michigan can be distinguished in the United States. The current flat and “swing,” which are noticed on 24-hour and 4-hour timescales, are in first place in terms of importance.
Trading strategy for the week of March 20–24:
1) The pound/dollar pair remains in the side channel between 1.1840 and 1.2440. Short positions are therefore more relevant right now, although it's unlikely that the pair will emerge from the side channel anytime soon. Thus, we suggest delaying additional sales until the 1.1840 level is broken. Then, taking short positions with a target 300–400 points lower will make sense.
2) Purchases won't be important unless the price is fixed above the crucial line or there is another powerful signal. Yet, given the flat market, even fixing above Kijun-sen does not ensure the rise will resume. In the recent past, when the side channel was rebounding from its lower boundary towards its upper border, we also recommended buying. Officially, the pair is currently capable of rising to a level of 1.2440, but next week, with a strong fundamental backdrop, there will be an opportunity for virtually any movement inside the flat.
Explanations for the illustrations:
Fibonacci levels, which serve as targets for the beginning of purchases or sales, and price levels of support and resistance (resistance/support). Take Profit levels may be close by.
Bollinger Bands, MACD, and Ichimoku indicators (standard settings) (5, 34, 5).
The net position size of each trading category is represented by indicator 1 on the COT charts.
The net position size for the “non-commercial” category is shown by indicator 2 on the COT charts.

WikiFX-Broker
Aktuelle Nachrichten
Datenanalyse: Wirtschaftskrise trifft zunehmend Mittelstand
Marktanteil von E-Autos steigt wieder – Negativtrend nach Förderstopp vorbei, glaubt Experte
Elon Musk wird Nissan nicht retten – der japanische Autobauer braucht eine neue Strategie
US-Aktien unter Druck: Diese drei Gründe stecken hinter dem schlechtesten Börsen-Tag des Jahres
Wechselkursberechnung


