2024-09-21 22:05
IndustryTechnical Analysis
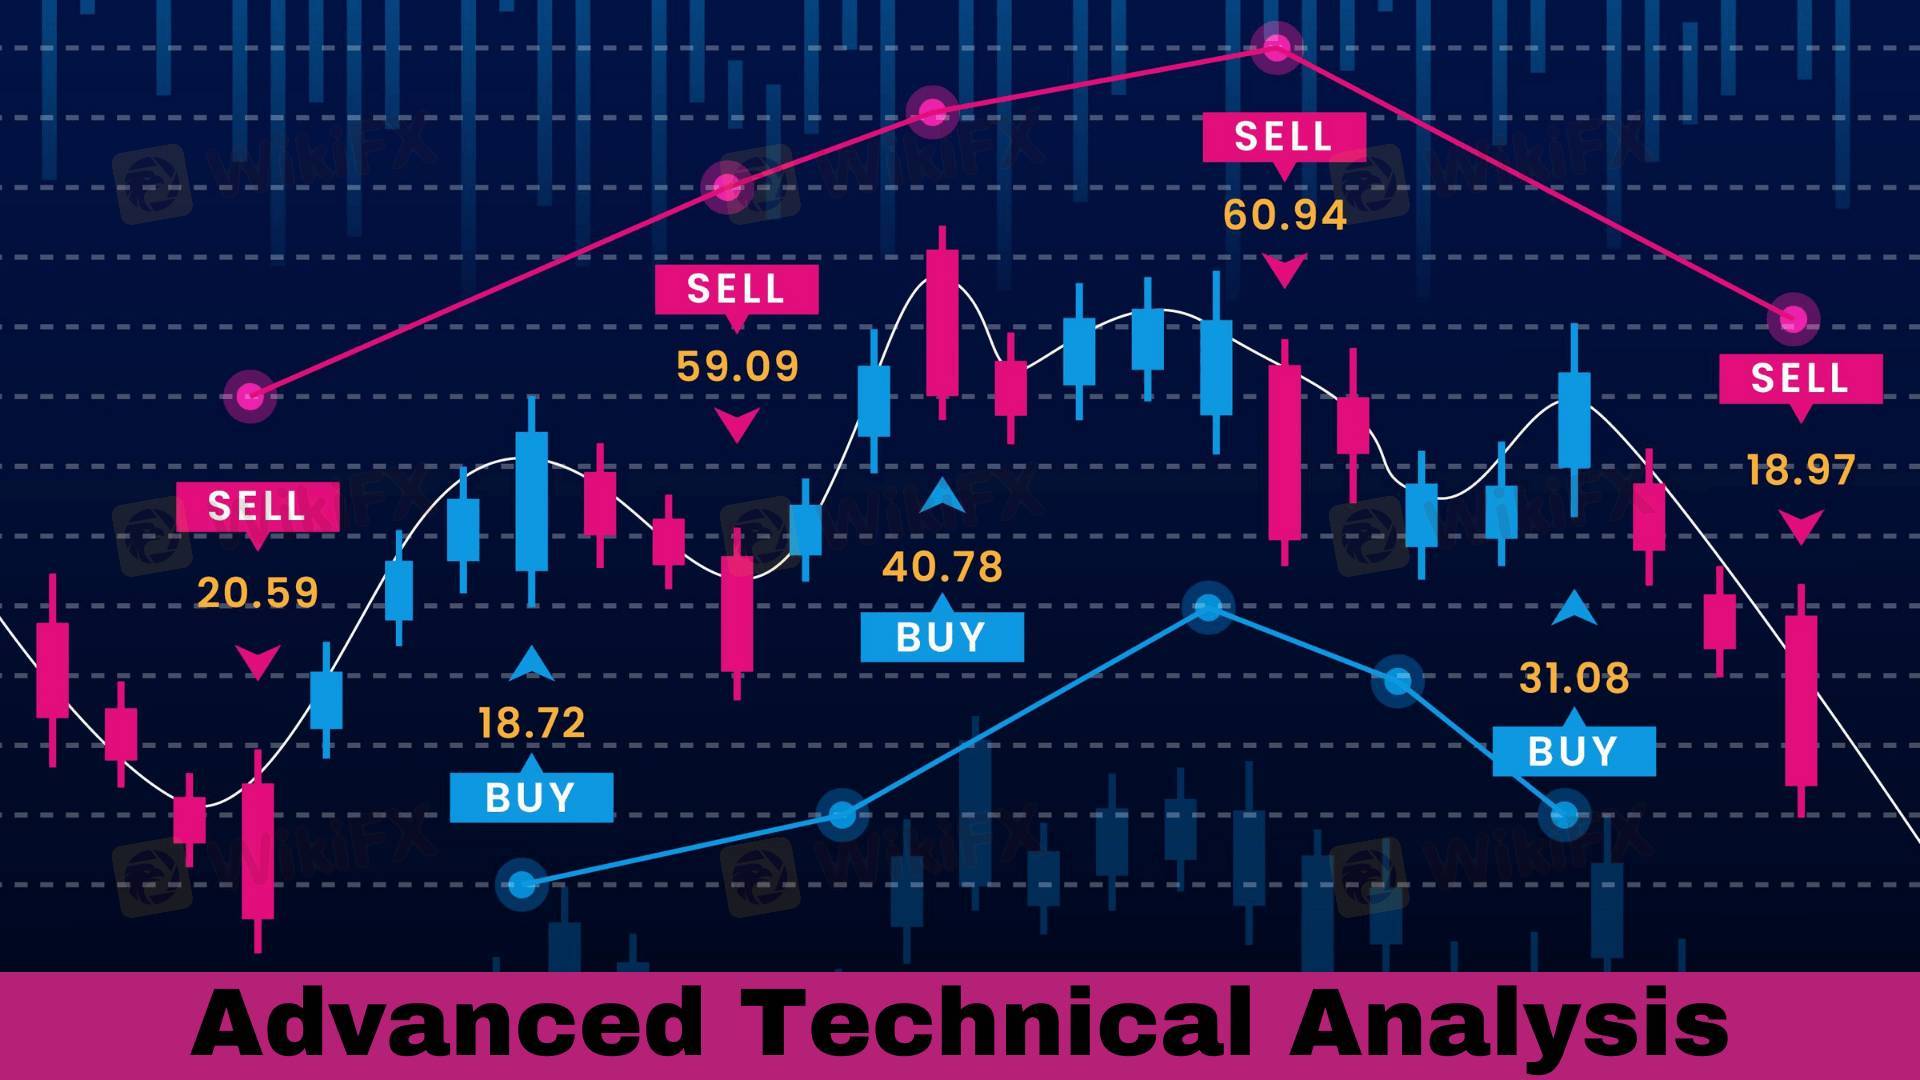
Technical analysis involves studying market data, primarily price and volume, to identify patterns and trends, and make informed trading decisions.
Key Components:
1. Charts: Line, Bar, Candlestick
2. Patterns: Reversal (Head & Shoulders, Inverse Head & Shoulders), Continuation (Triangles, Wedges)
3. Trends: Uptrend, Downtrend, Sideways
4. Indicators: Moving Averages, RSI, MACD, Bollinger Bands
5. Oscillators: Stochastic, Force Index
Technical Analysis Tools:
1. Chart Patterns: Identify reversals and continuations
2. Trend Lines: Draw lines connecting highs/lows
3. Support/Resistance: Identify key price levels
4. Moving Averages: Smooth price data
5. Relative Strength Index (RSI): Measure overbought/oversold conditions
Types of Technical Analysis:
1. Fundamental Analysis: Examines economic, financial, and company data
2. Quantitative Analysis: Uses mathematical models
3. Sentiment Analysis: Analyzes market sentiment
Advantages:
1. Identifies trends and patterns
2. Provides objective data
3. Helps predict price movements
4. Enables risk management
Disadvantages:
1. Not foolproof
2. Requires expertise
3. Ignores fundamental factors
Best Practices:
1. Combine with fundamental analysis
2. Use multiple time frames
3. Monitor indicator divergence
4. Adjust for market context
Example:
GBP/USD, 4-hour chart:
1. Identify Head & Shoulders pattern
2. Draw trend line
3. Set stop-loss below neckline
4. Take-profit at next resistance level
To master Technical Analysis:
1. Study chart patterns
2. Learn indicator applications
3. Practice analysis
4. Stay updated on market developments
Like 0

李强7520
Trader
Hot content
Industry
Event-A comment a day,Keep rewards worthy up to$27
Industry
Nigeria Event Giveaway-Win₦5000 Mobilephone Credit
Industry
Nigeria Event Giveaway-Win ₦2500 MobilePhoneCredit
Industry
South Africa Event-Come&Win 240ZAR Phone Credit
Industry
Nigeria Event-Discuss Forex&Win2500NGN PhoneCredit
Industry
[Nigeria Event]Discuss&win 2500 Naira Phone Credit
Forum category

Platform

Exhibition

Agent

Recruitment

EA

Industry

Market

Index
Technical Analysis
 | 2024-09-21 22:05
Technical analysis involves studying market data, primarily price and volume, to identify patterns and trends, and make informed trading decisions.
Key Components:
1. Charts: Line, Bar, Candlestick
2. Patterns: Reversal (Head & Shoulders, Inverse Head & Shoulders), Continuation (Triangles, Wedges)
3. Trends: Uptrend, Downtrend, Sideways
4. Indicators: Moving Averages, RSI, MACD, Bollinger Bands
5. Oscillators: Stochastic, Force Index
Technical Analysis Tools:
1. Chart Patterns: Identify reversals and continuations
2. Trend Lines: Draw lines connecting highs/lows
3. Support/Resistance: Identify key price levels
4. Moving Averages: Smooth price data
5. Relative Strength Index (RSI): Measure overbought/oversold conditions
Types of Technical Analysis:
1. Fundamental Analysis: Examines economic, financial, and company data
2. Quantitative Analysis: Uses mathematical models
3. Sentiment Analysis: Analyzes market sentiment
Advantages:
1. Identifies trends and patterns
2. Provides objective data
3. Helps predict price movements
4. Enables risk management
Disadvantages:
1. Not foolproof
2. Requires expertise
3. Ignores fundamental factors
Best Practices:
1. Combine with fundamental analysis
2. Use multiple time frames
3. Monitor indicator divergence
4. Adjust for market context
Example:
GBP/USD, 4-hour chart:
1. Identify Head & Shoulders pattern
2. Draw trend line
3. Set stop-loss below neckline
4. Take-profit at next resistance level
To master Technical Analysis:
1. Study chart patterns
2. Learn indicator applications
3. Practice analysis
4. Stay updated on market developments
Like 0
I want to comment, too
Submit
0Comments

There is no comment yet. Make the first one.

Submit
There is no comment yet. Make the first one.