2024-09-22 19:10
IndustryRelative Strength Index
Overview
The Relative Strength Index (RSI) is a momentum oscillator developed by J. Welles Wilder Jr. to measure the magnitude of recent price changes.
Calculation
RSI = 100 - (100 / (1 + RS))
Where RS = Average gain of up days / Average loss of down days
Interpretation
1. Overbought: RSI > 70 (price may drop)
2. Oversold: RSI < 30 (price may rise)
3. Neutral: RSI between 30-70 (price may fluctuate)
Key Levels
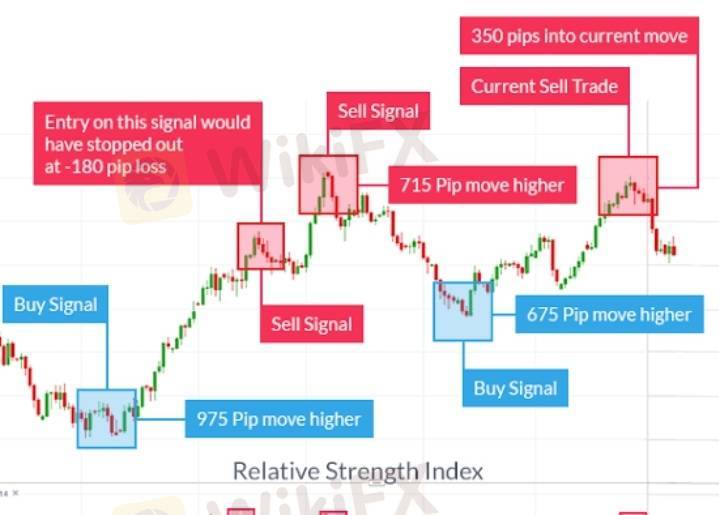
1. 30: Oversold level (buy signal)
2. 70: Overbought level (sell signal)
3. 50: Neutral level (no signal)
Signals
1. Bullish Divergence: RSI makes higher low, price makes lower low
2. Bearish Divergence: RSI makes lower high, price makes higher high
3. RSI Breakout: RSI breaks above/below key levels
Settings
1. Period: 14 (default), adjustable to suit market conditions
2. Timeframe: Any (e.g., 1-minute, 1-hour, daily)
Advantages
1. Identifies overbought/oversold conditions
2. Confirms trends
3. Provides early warning signals
Limitations
1. False signals in strong trends
2. Lagging indicator
3. Should be used with other indicators
Bitcoin Trading Strategies Using RSI
1. Mean reversion: Buy/sell when RSI reaches extreme levels
2. Trend following: Use RSI to confirm trends
3. Range trading: Buy/sell when RSI reaches key levels
Best Practices
1. Combine RSI with other indicators
2. Adjust settings for market conditions
3. Monitor multiple timeframes
4. Use proper risk management
5. Continuously learn and improve analytical skills
Like 0
FX1815522271
Agent
Hot content
Industry
Event-A comment a day,Keep rewards worthy up to$27
Industry
Nigeria Event Giveaway-Win₦5000 Mobilephone Credit
Industry
Nigeria Event Giveaway-Win ₦2500 MobilePhoneCredit
Industry
South Africa Event-Come&Win 240ZAR Phone Credit
Industry
Nigeria Event-Discuss Forex&Win2500NGN PhoneCredit
Industry
[Nigeria Event]Discuss&win 2500 Naira Phone Credit
Forum category

Platform

Exhibition

Agent

Recruitment

EA

Industry

Market

Index
Relative Strength Index
 | 2024-09-22 19:10
Overview
The Relative Strength Index (RSI) is a momentum oscillator developed by J. Welles Wilder Jr. to measure the magnitude of recent price changes.
Calculation
RSI = 100 - (100 / (1 + RS))
Where RS = Average gain of up days / Average loss of down days
Interpretation
1. Overbought: RSI > 70 (price may drop)
2. Oversold: RSI < 30 (price may rise)
3. Neutral: RSI between 30-70 (price may fluctuate)
Key Levels
1. 30: Oversold level (buy signal)
2. 70: Overbought level (sell signal)
3. 50: Neutral level (no signal)
Signals
1. Bullish Divergence: RSI makes higher low, price makes lower low
2. Bearish Divergence: RSI makes lower high, price makes higher high
3. RSI Breakout: RSI breaks above/below key levels
Settings
1. Period: 14 (default), adjustable to suit market conditions
2. Timeframe: Any (e.g., 1-minute, 1-hour, daily)
Advantages
1. Identifies overbought/oversold conditions
2. Confirms trends
3. Provides early warning signals
Limitations
1. False signals in strong trends
2. Lagging indicator
3. Should be used with other indicators
Bitcoin Trading Strategies Using RSI
1. Mean reversion: Buy/sell when RSI reaches extreme levels
2. Trend following: Use RSI to confirm trends
3. Range trading: Buy/sell when RSI reaches key levels
Best Practices
1. Combine RSI with other indicators
2. Adjust settings for market conditions
3. Monitor multiple timeframes
4. Use proper risk management
5. Continuously learn and improve analytical skills
Like 0
I want to comment, too
Submit
0Comments

There is no comment yet. Make the first one.

Submit
There is no comment yet. Make the first one.