2024-09-22 23:36
IndustryBitcoin Technical Analysis
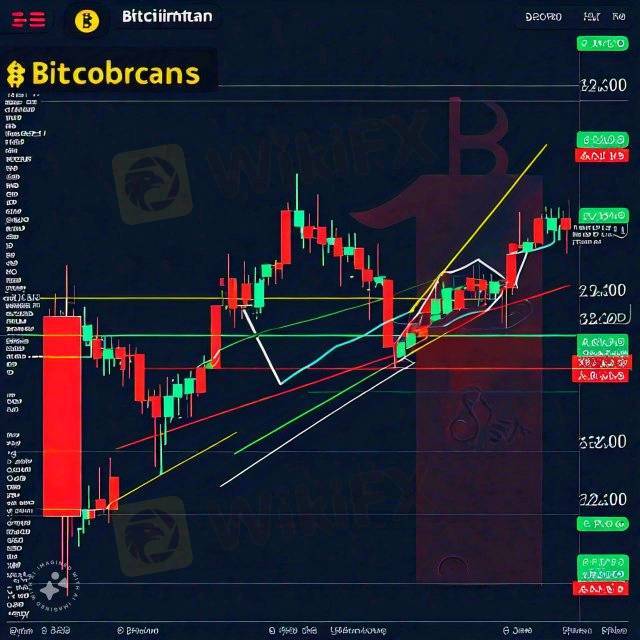
Bitcoin technical analysis involves examining charts and patterns to predict future price movements, utilizing various indicators, chart patterns, and candlestick patterns to identify trends, reversals, and potential trading opportunities. This includes analyzing moving averages, relative strength index (RSI), Bollinger Bands, and other indicators to gauge market sentiment and identify potential buy or sell signals. Chart patterns such as head and shoulders, triangles, and wedges help identify reversals or continuations, while candlestick patterns like doji, hammer, and engulfing patterns provide insight into market psychology. Additionally, bitcoin-specific indicators like hash rate, difficulty adjustment, and network activity are considered. Technical analysts also employ various trading strategies, such as trend following, range trading, and breakout trading, and utilize tools like Trading view and Coinigy to stay informed. By combining these techniques, analysts aim to make informed investment decisions, manage risk, and capitalize on market opportunities, while acknowledging the subjective nature of technical analysis and importance of ongoing learning and adaptation.
Like 0
FX1823571897
Trader
Hot content
Industry
Event-A comment a day,Keep rewards worthy up to$27
Industry
Nigeria Event Giveaway-Win₦5000 Mobilephone Credit
Industry
Nigeria Event Giveaway-Win ₦2500 MobilePhoneCredit
Industry
South Africa Event-Come&Win 240ZAR Phone Credit
Industry
Nigeria Event-Discuss Forex&Win2500NGN PhoneCredit
Industry
[Nigeria Event]Discuss&win 2500 Naira Phone Credit
Forum category

Platform

Exhibition

Agent

Recruitment

EA

Industry

Market

Index
Bitcoin Technical Analysis
 | 2024-09-22 23:36
Bitcoin technical analysis involves examining charts and patterns to predict future price movements, utilizing various indicators, chart patterns, and candlestick patterns to identify trends, reversals, and potential trading opportunities. This includes analyzing moving averages, relative strength index (RSI), Bollinger Bands, and other indicators to gauge market sentiment and identify potential buy or sell signals. Chart patterns such as head and shoulders, triangles, and wedges help identify reversals or continuations, while candlestick patterns like doji, hammer, and engulfing patterns provide insight into market psychology. Additionally, bitcoin-specific indicators like hash rate, difficulty adjustment, and network activity are considered. Technical analysts also employ various trading strategies, such as trend following, range trading, and breakout trading, and utilize tools like Trading view and Coinigy to stay informed. By combining these techniques, analysts aim to make informed investment decisions, manage risk, and capitalize on market opportunities, while acknowledging the subjective nature of technical analysis and importance of ongoing learning and adaptation.
Like 0
I want to comment, too
Submit
0Comments

There is no comment yet. Make the first one.

Submit
There is no comment yet. Make the first one.