15 Most Popular Forex Chart Patterns
Abstract:Forex chart patterns help traders identify market entry points and profit targets. It allows traders to place stop-loss orders and minimise potential losses.

Forex chart patterns help traders identify market entry points and profit targets. It allows traders to place stop-loss orders and minimise potential losses.
There are different types of chart patterns available – some depict trend reversal points, signalling you to enter or exit the market immediately, while some help identifies market trends.
Staying aware of the various Forex chart patterns can help you analyse future market price movements and make better trade decisions. In this article, we discuss the top 15 chart patterns that every Forex trader should know.
What are Forex chart patterns?
A Forex market chart pattern is a graphical representation of the currency pair prices. It depicts the historical and current prices of the currency pair to help traders predict future currency pair prices. It is through these charts that traders can determine profitable entry and exit points along with analysing how long a trend has been existing and how soon a trend can come to an end.
Top Forex chart patterns you should know
1. Candlestick chart pattern
The candlestick chart patterns in Forex can predict the currency pairs market movement. It consists of the opening price, closing price, high price and low price of the currency pair that helps traders identify if the market is moving in an upward direction or downward direction.
When a candlestick pattern indicates a downward moment, it signals traders to exit the trade as soon as possible to minimise losses.
When a candlestick pattern indicates an upward movement, it signals traders to enter the trade as soon as possible to maximise profits.

2. Double top double bottom chart pattern
The double bottom double top chart pattern indicates trend reversals. They consist of either two high prices (double top) or two low prices (double bottom) of the currency pair. It is unlikely for a currency pair to move beyond the high price point and below the low price point after it does so twice on different occasions.
Whenever a currency pair price reaches an all-time high price twice, it sends a signal of a downward market movement thereafter. Exiting the current position can minimise losses.
Whenever a currency pair price reaches an all-time low price twice, it sends a signal of an upward market movement thereafter. Theoretically, this indicates a sell position on the current market.

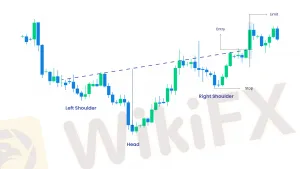
3. Head and shoulders chart pattern
The head and shoulders chart patterns are used to predict a downward market situation. It helps traders analyse how much the price of the currency pair is going to fall and in what intervals. This, in turn, leads to the traders making an exit choice to minimise potential losses. There generally exist two price highs before and after a significant price high, indicating falling prices thereafter.

4. Inverse head and shoulder chart pattern
The inverse head and shoulder chart patterns are used to predict an upward movement. This chart pattern helps traders predict how much the price of a currency pair is going to rise in the future and in what intervals. This leads the traders into making entry decisions in the market to maximise their profits. There are generally two price lows before and after a significant price low in the chart pattern, after which there is a surety of a market rise.
5. Rising and falling wedges chart pattern
The rising and falling wedges chart pattern indicates market breakouts. They consist of a price range that becomes too narrow and results in a final breakout that marks a trend reversal.
Rising wedges are chart patterns that occur due to an upward price consolidation. This is followed by a sharp price fall and is a bear signal to the traders that signals them to exit the market as soon as possible
Falling wedges are chart patterns that occur due to a downward price consolidation. This is followed by a sharp price rise and is a bull signal to the traders that signals them to exit the market as soon as possible

6. Hammer and inverted hammer chart pattern
The hammer chart pattern is a part of the candlestick patterns. However, this particular chart is solely dedicated to identifying the lowest low in the currency pair price. It helps traders identify a market trend reversal at the lowest low point, enabling them to make market entry decisions that are profitable.
On the other hand, the inverted hammer chart pattern helps in identifying the highest high price of a currency pair. This enables traders to identify a downward trend reversal, sending them exit signals in the Forex market to minimise losses.

7. Butterfly chart pattern
The butterfly chart pattern helps traders identify market reversals well before time. This leads to the traders making significant trade decisions with respect to the entry and exit prices. It starts from either a high price of a currency pair, followed by the low swing or vice versa. Often, the butterfly pattern also looks like M in a bullish market and W in a bearish market, signalling multiple trend reversals.
When there is an upward market trend reversal, it signals traders to buy more of the currency pair to lock in additional profits
When there is a downward market trend reversal, it signals traders to sell more of the currency pair to protect themselves against any losses
8. Engulfing chart pattern
The engulfing chart pattern is used to identify the entry and exit points. During an uptrend, it is advised to place entry orders right above the high currency pair price, and during a downtrend, it is best to pace exit orders right below the low currency pair price. These patterns also signal trend reversals that again help traders to enter or exit the market accordingly.
You can identify a bullish engulfing pattern right after a downtrend whenever the candle moves beyond the currency pair prices of the previous day
You can identify a bearish engulfing pattern right after an uptrend whenever the candle moves below the currency pair prices of the previous day

9. Shooting star chart pattern
The shooting star chart pattern is formed whenever a currency pair price opens at a high, continues to trade at a higher price and then comes back down to close near the price where it opened. This pattern indicates that the currency pair prices can start falling anytime and send market trend reversal signals. The reversal signal leads to traders exiting the market at the highest price point to maximise their returns.
Traders are advised to short the stock immediately if the currency pair prices decline during the day
Traders can place a buy order for the short-term during the continuous increase in the currency pair price during the day but exit the trade before the market closes

10. Triangle chart pattern
The triangle chart pattern is used to signal a continuous existing trend. This means, whenever a triangle chart appears in the market, it signals the traders to continue buying during an uptrend and sell the currency pair during a downtrend. Two trend lines that converge are drawn from one single point to draw the triangle, indicating that the currency pair price first moves in sideways and then continues in the same direction. There are three main triangles to look for in a Forex chart pattern
An ascending triangle indicates a bullish continued pattern signifying that the market is going to continue in the uptrend, and traders can buy more of the currency pair
A descending triangle indicates a bearish continued market pattern signifying that the Forex market is going to continue in the downtrend, and traders should sell the currency pair to avoid losses
Symmetrical triangles are either bullish or bearish in nature. It forms whenever the prices converge with the lows and highs, indicating either bearish trends or bullish trends

11. Cup and handle chart pattern
The cup and handle chart pattern is used to identify the price points to go long or enter the market. It shows a bearish market movement which soon converts into a bullish trend. The cup is that of a ‘U’ shape followed by prices that trade close to each other, making its handle. When the pattern exists in the market for a few months, it indicates a strong bullish trend for the currency pair.

12. Doji star chart pattern
The Doji chart patterns include the opening and closing prices of the currency pair to be very close to each other. It sends an indecisive signal to the market with a prediction of a trend reversal in the future.
If there is an upward market movement through a Doji candlestick pattern, it can lead to the market reversing to a downward sentiment
If there is a downward market movement through a Doji candlestick pattern, it can lead to the market reversing to an upward sentiment

13. Pennant chart patterns
The pennant chart pattern indicates continuation. In this pattern, the currency pair prices witness significant downward or upward movements that are followed by smaller upward or downward movements later.
When there is a bull pennant, it signals traders to enter the market since the market continues with the uptrend leading to profits
When there is a bear pennant, it signals traders to exit the market since the market continues with the downtrend leading to losses

14. Bullish rectangle chart pattern
The bullish rectangle chart pattern occurs due to the pause in the increasing currency pair prices. It is a continuous trend where the prices have a non-volatile support and resistance level that helps the price breakout after trading at the same level.
During the bullish phase, the prices keep on increasing and form the bullish rectangle chart pattern that sends traders a signal to enter the trade and buy more of the currency pair to maximise profits.
Only enter the trade when the price either crosses the resistance level or goes below the support level
Place take profit orders equal to the distance between the support price and resistance price
Place the stop-loss orders either above the resistance price or below the support price

15. Bearish rectangle chart pattern
The bearish rectangle chart pattern occurs due to a pause in the falling currency pair prices in the forex market. The continuous trend includes a non-volatile change in the support and resistance levels of the currency pair. These levels help the pair to break out in the later stages after trading at the same level for some time.
During the bearish phase, the prices keep on decreasing and form the bearish rectangle chart pattern that sends traders a signal to exit the trade and sell more of the currency pair as soon as possible to minimise losses.
Exit the trade when the currency pair price is right above the resistance level
During a downtrend, place the stop loss order right above the resistance price

Start using Forex chart pattern in your trading strategies
Forex charts help you identify the most profitable entry prices, exit processes, take profit levels and stop-loss levels. They enable you to study the historical price movements that contribute to the analysis of future price movements.
Join Blueberry Markets to start Forex trading today in a transparent and reliable platform. Sign up for a live trading account or try a risk-free demo account.

Read more

Gold and Silver Price Predictions and Trends 2026
Gold and Silver Forecast 2026 offers expert predictions, price insights, and market analysis to help shape your investment decisions.

GMI to Stop Global Operations from Dec 31, 2025; Don’t Miss the Final Withdrawal Deadline
Taking the financial market by surprise, GMI, one of the leading global forex and CFD brokers, announced its intention to close its global operations from December 31, 2025. Since the official shutdown announcement, traders have been concerned about the status of fund deposits and withdrawals. They have understandably been searching for answers to these questions amid this announcement made by the group. Read on as we share with you key details emerging from the development.

Libertex Exposed: Allegations of Fund Scams and Delayed Withdrawals Surface
Have you been made to take a loan from the Libertex official after losing in a trade? But did that also prove financially disastrous? Do you find varying experiences when depositing and withdrawing, with the former being smooth and the latter being worse? It is arguably the pattern for most traders as they share negative Libertex reviews online. In this article, we have discussed these complaints in greater detail. Read further!

Introducing Broker in Forex Trading: Meaning, Roles, Responsibilities & Fees
Acting as an intermediary between traders and brokerage firms, Introducing Brokers (IBs) can be both a company and an individual. They do not have a role in trade execution or account management. Their role is to offer advice and let clients open trading accounts and trade on the platform. In this article, we have discussed the meaning of the term 'introducing broker,' its role, payment structure, and other related aspects. Read on!
WikiFX Broker
Latest News
Spring Rally in Chinese Equities Signals Potential Lift for AUS and NZD
 WikiFX
China’s Export Resilience: A Structural Pivot Towards the 'Global South'
WikiFXSilver Smashes $70: Is the "Forced Central Bank Buying" Thesis Playing Out?
WikiFXBiggest 2025 FX surprise: USD/JPY
WikiFXNFA Charges Japan’s Forex Wizard and Mitsuaki Kataoka With Delaying Withdrawal Requests
WikiFXWhy Your Entries Are Always Late (And How to Fix It)
WikiFX【WikiEXPO Global Expert Interviews】Robert Hahm: From Asset Management to AI Innovation
WikiFXTreasury vs. Fed: Bessent leads Trump's Campaign to Reshape US Monetary Policy
WikiFXCeasefire on the Brink: 14 Nations Condemn Israel as Geopolitical Risk Premiums Rise
WikiFXRinggit hits five-year high against US dollar in holiday trade
WikiFXRate Calc

