Mohicans markets:Gold Fundamentals Focus On Central Bank Annual Meeting Crude Oil Technical Short-term Double Top
Abstract:On Friday August 26, spot gold in the Asian session fell into a range-bound range and failed to stand above the pivot point. The primary support is 1751.23. Spot silver fluctuated in a narrow range around the pivot point of 19.22, and the market outlook faces a choice of direction.

Key Data
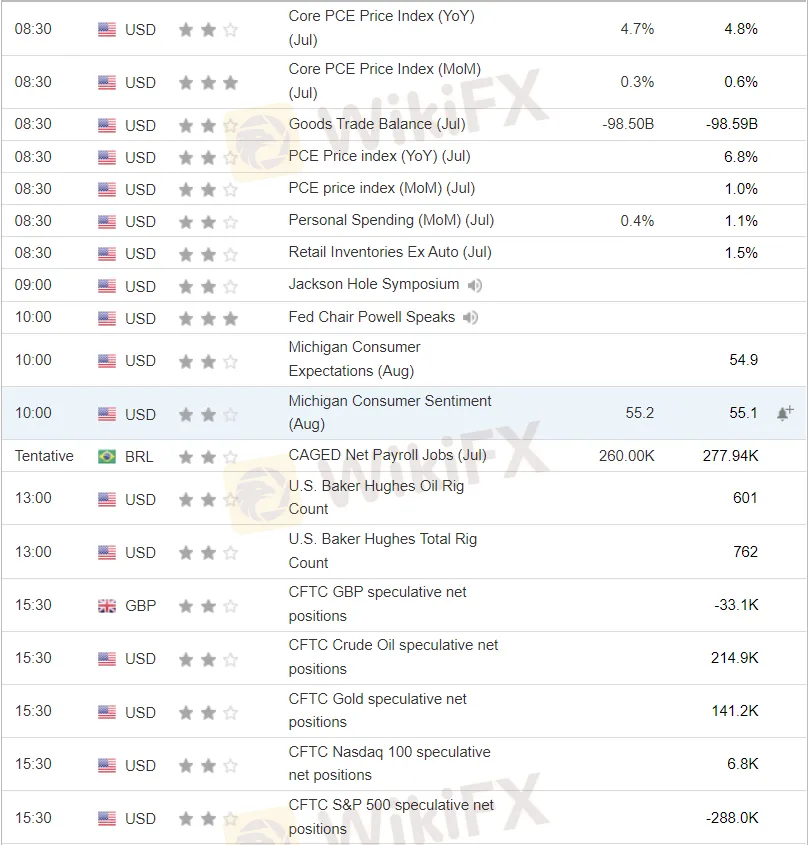
Fundamentals Overview
On Friday August 26, spot gold in the Asian session fell into a range-bound range and failed to stand above the pivot point. The primary support is 1751.23. Spot silver fluctuated in a narrow range around the pivot point of 19.22, and the market outlook faces a choice of direction.WTI crude oil rose above the pivot point of 93.50, and the first upward target is 94.11.The dollar index is higher above the pivot point at 108.40, with 108.92 as the primary resistance.
The Mohicans Markets strategy is for reference only and not as investment advice. Please read the terms of the statement at the end of the article carefully. The following strategy was updated at 16:30 on August 25, 2022, Beijing time.
Technical View
ONE · Technical Level · International Gold
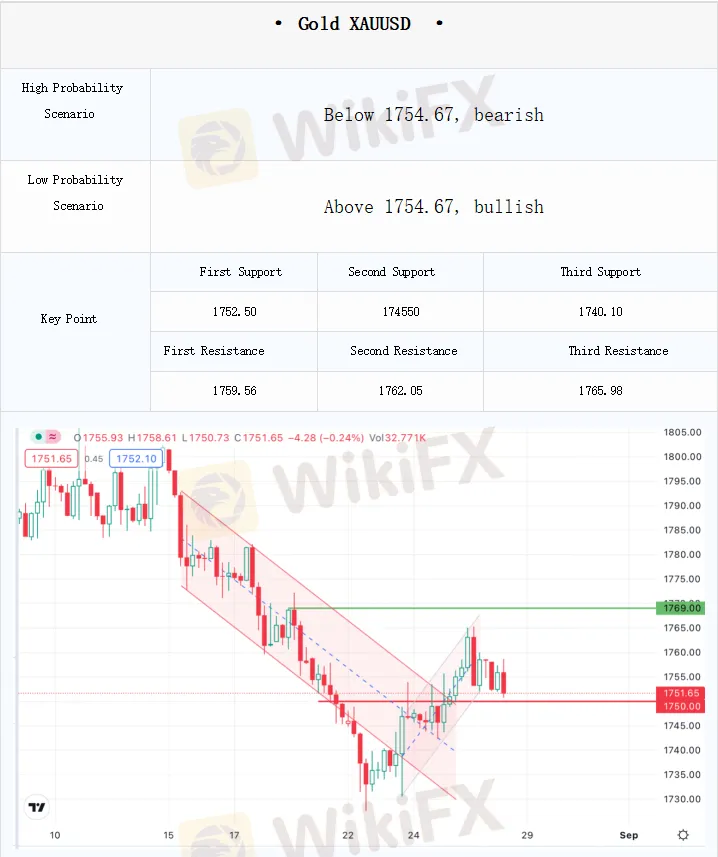
1770 M20 resistance
1762-65 Daily high resistance
1760 The starting point of heavy volume decline in the US session, resistance in Asia and Europe
1754-52 Band resistance becomes the support of the Asian-European plate, which is also the upward trend line on the hourly line.
1745 Important support during the day
1740 Secondary Support
Technical Analysis
Yesterday, the Fed officials' speech was hawkish, but not out of the ordinary. In addition, the futures open interest fell again yesterday, indicating that the gold wait-and-see mood is still high. Yesterday's market was still dominated by short-term funds, and the bulls temporarily lacked momentum before the Jackson Hole annual meeting. From the perspective of the general trend, the most important support in the day is still around 1745. There is a large stock of call options here, and the support has been tested. If it closes below this support on Friday, the daily line may face a lot of pullback pressure. In the absence of momentum for the bulls, the higher the price, the denser the resistance, 1760, 1762-65, 1770-1772 may all have resistance. The biggest hope for short-term breakthrough of these resistances comes from fundamental sentiment. For example, the Jackson Hole annual meeting will release a dovish signal that exceeds expectations.
Note: The above strategy was updated at 16:00 on August 26. This strategy is a day strategy, please pay attention to the release time of the strategy.
TWO · Technical Level · Spot Silver
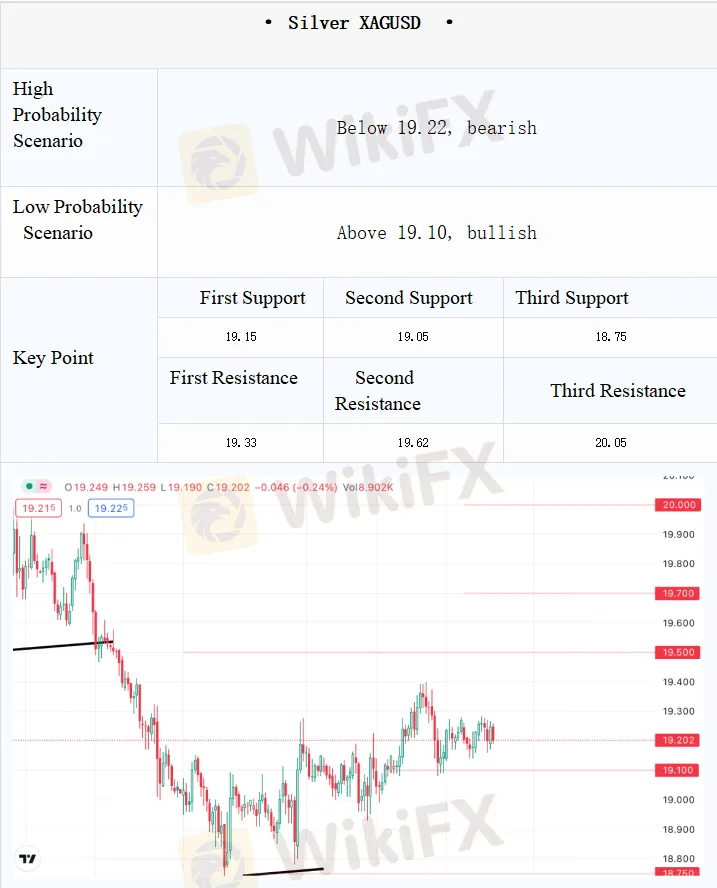
20 Bullish increase and large stock, bearish increase slightly, long target
19.6 Bullish increase, bearish unchanged, long target
19.3 Bullish decrease, unchanged, first resistance
19.1-19.2 Bullish increase, bearish increase, support zone
19 Bullish increase, bearish increase slightly, next support
18.75 Bullish increase slightly, bearish decrease in equal amount, important support
18.6 Bullish unchanged, bearish increasing, bearish target
Technical Analysis
On Thursday, silver remained range-bound, climbed in the Asian session and fell back in the European session, and finally rebounded slightly in the US session, and is still below the intraday resistance of 19.4. In terms of options distribution, both long and short funds are mainly based on adding positions, which may be betting on the risk of the Jackson Hole annual meeting tonight, but the differences between long and short positions are still obvious, and there is no clear direction for the time being.
Among them, 19.1-19.2 added a lot of call options and put options, which will compete for the range between long and short, and there is support.
Above, it is basically the entry of long funds. If 19.26-19.3 breaks through, it may look at the upward target of 19.6 and the long target of 20. During the period, you can pay attention to the resistance near 19.4 and 19.5. On the downside, 18.9-19 is the midline support. If it falls below, it may look to the important support of 18.75, where there are put options to leave, and then the short target is near 18.6.
Note: The above strategy was updated at 16:00 on August 26. This strategy is a day strategy, please pay attention to the release time of the strategy.
THREE · Technical Level · US Crude Oil
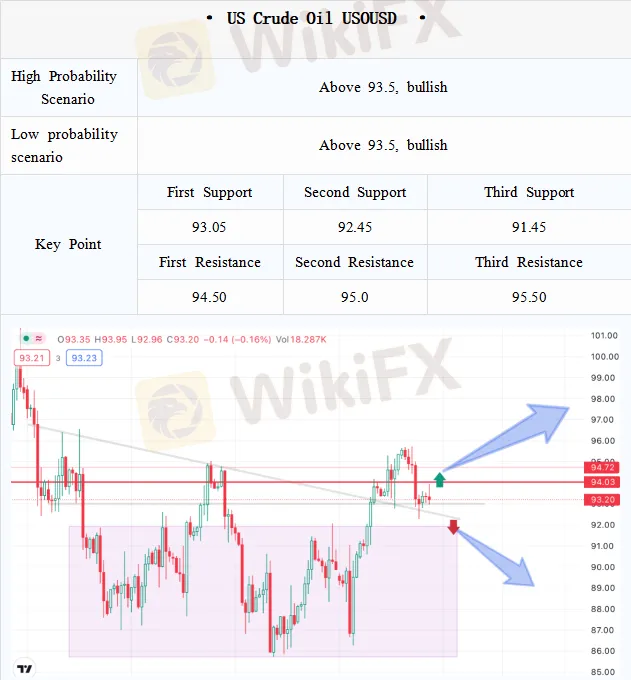
96 Midline resistance, strong
95 The starting point of the heavy volume decline in the US session, the resistance level
93 Support (may be Asia-Europe session)
91.8-91.4 Intraday support
91 Trend Support
Technical Analysis
The resistance of 95-96 failed to break through last night, and the market may temporarily begin to pay attention to the prospect of a downward trend in the US dollar, confirmed by a 4-hour double top. However, the impact of the U.S. dollar on oil is indirect after all. If the 93 support can take effect and the callback ends early, then the upward movement may be able to recover. Otherwise, it is necessary to pay attention to whether the support at 91.8-91.4 takes effect, opening a new wave of gains or forming a double top pattern. .
Note: The above strategy was updated at 16:00 on August 26. This strategy is a day strategy, please pay attention to the release time of the strategy.
FOUR · Technical Level · EURUSD
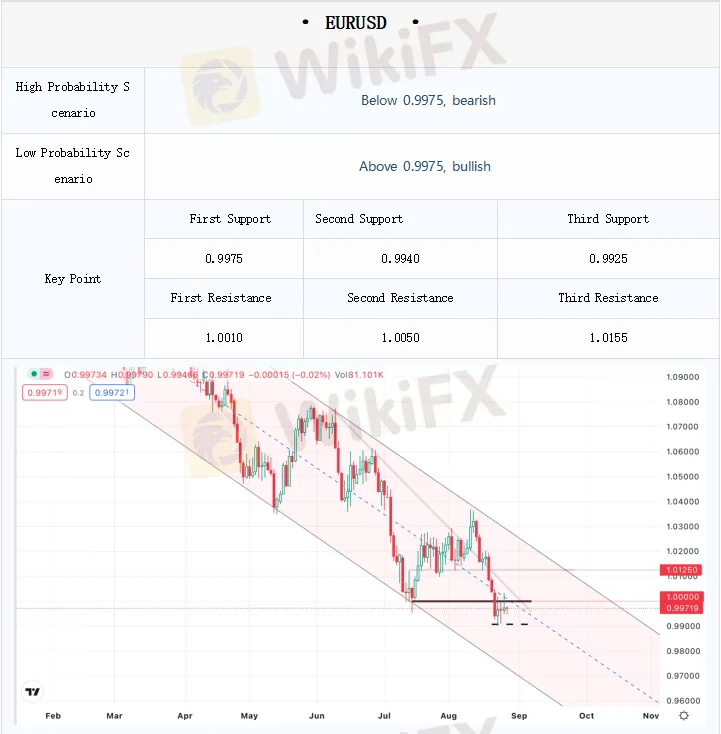
1.0175-1.02 Bullish decrease, bearish unchanged, upper action weaken
1.0050-1.0150 bullish increase, bearish unchanged, focus on the upper action
1.00 Bullish increase, bearish increase, long and short contention
0.9975 bullish unchanged, bearish increase, break the level focus on resistance
0.99-0.9925 Bullish decrease, bearish decrease, downside action weaken
Technical Analysis
On Thursday, EURUSD weakened in the European session, touching a high of 1.0033 before the European session and then moving all the way down. The U.S. market tested the 0.9950 key level suggested in yesterdays report, held steady and then rebounded slightly, and is now stuck in the 0.9950-0.9980 range oscillation.
Options changes show that the parity level is still being contested between long and short. It is expected that Europe and the United States is still dominated by pressure before the level is stabilized, especially it is necessary to caution to see the upside pressure increase if it is below 0.9975. However, given the reduction in 0.99 puts, it is expected to limit downside momentum, thus limiting the downtrend above 0.99. However, please be wary of the risk of further downside pressure at 0.9850 if it falls below this level.
On the other hand, please watch for upside momentum if Europe and the US can regain stability at 1.00. 1.0050-1.0150 has sporadic call options increase, while considering the bearish options stock advantage in this range, it is expected that Europe and the United States is difficult to have strong upside action. Pay attention to reversal signals.
Note: The above strategy was updated at 16:00 on August 26. This strategy is a day strategy, please pay attention to the release time of the strategy.
FIVE · Technical Level · GBPUSD
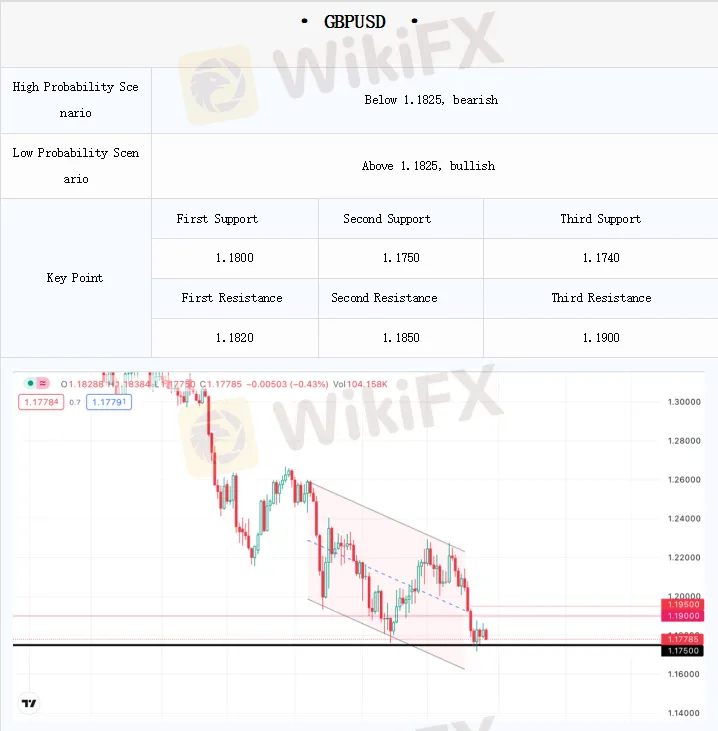
1.19 Bullish unchanged, bearish reduce significantly, resistance weaken
1.1850 Bullish reduce, bearish unchanged but stock dominant, resistance
1.1820 Bullish and bearish unchanged, but the stock is large, resistance weaken
1.18 Bullish increase, bearish unchanged but the stock is large, key support
1.1750 Bullish unchanged, bearish unchanged but the stock is large, short target
Technical Analysis
On Thursday, GBPUSD moved up before the European session, but it was stopped in the key 1.1850-1.1870 range mentioned in yesterdays report, while the pullback momentum was halted at 1.18 support. It is currently caught in a range oscillation of 1.18-1.1850. 1.18 has call option inflows, while below that level options lack three new layouts and the stock looks to be dominated by puts. It is expected that the short term will constitute a key support, below the need to be wary of the short target 1.1750, 1.17. And 1.182 long and short positions are comparable, the short term may have some contention, constituting upside resistance. Above 1.1850 still constitutes resistance, breakthrough will look up to 1.19, where bearish options reduced by more than a third, resistance is expected to weaken, stabilization will look up to 1.20.
Note: The above strategy was updated at 16:00 on August 26. This strategy is a day strategy, please pay attention to the release time of the strategy.
SIX · Technical Level · AUDUSD
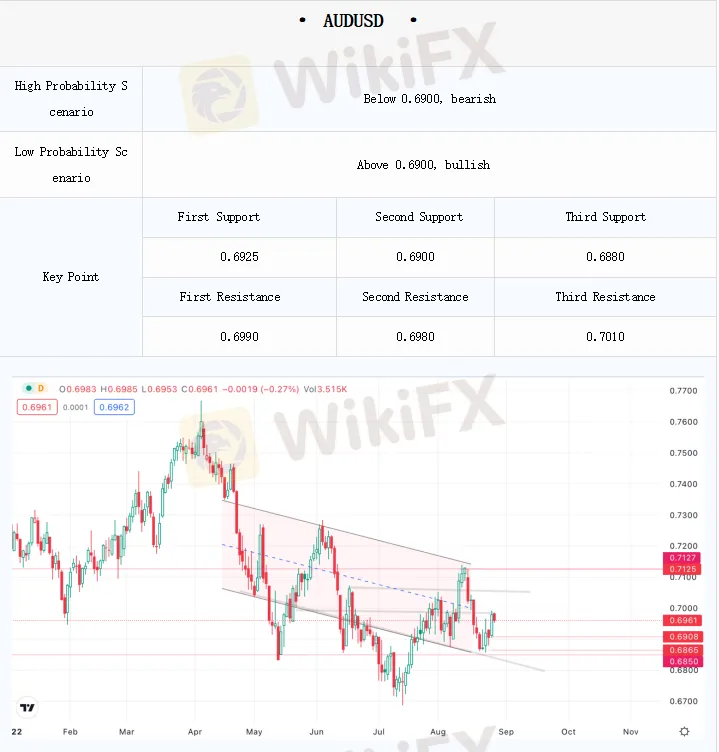
0.7 Bullish increase slightly and the stock is large, bearish decrease, long target
0.695 Bullish unchanged, bearish increase and the stock is large, short power strengthen
0.6925 Bullish unchanged, bearish increase, downside target
0.69 Bullish unchanged, bearish increase and the stock is large, short target
Technical Analysis
On Thursday, Asian and European markets failed to stand on the long target 0.7 due to the weakening of the U.S. dollar, Australia and the United States upward, and then range oscillation is dominant. Todays opening has fallen and is now testing the bottom of the range at 0.695. because the position of the short force has strengthened, downward momentum is expected to strengthen if today can fall below, or will further test the downside target 0.6925, as well as the short target 0.69. Both positions short have added a large number of bets, probably waiting for tonight's central bank annual meeting market. 0.7 remains a key position and is a long target due to the large stock of call options, standing firm ahead of an expected return to the upside.
Note: The above strategy was updated at 16:00 on August 26. This strategy is a day strategy, please pay attention to the release time of the strategy.
Statement | Disclaimer
Disclaimer: The information contained in this material is for general advice only. It does not take into account your investment goals, financial situation or special needs. We have made every effort to ensure the accuracy of the information as of the date of publication. MHMarkets makes no warranties or representations about this material. The examples in this material are for illustration only. To the extent permitted by law, MHMarkets and its employees shall not be liable for any loss or damage arising in any way, including negligence, from any information provided or omitted from this material. The features of MHMarkets products, including applicable fees and charges, are outlined in the product disclosure statements available on the MHMarkets website. Derivatives can be risky and losses can exceed your initial payment. MHMarkets recommends that you seek independent advice.
Mohicans Markets, (Abbreviation: MHMarkets or MHM, Chinese name: Maihui), Australian Financial Services License No. 001296777.

Read more

Mohicans markets:European Market
On Monday, October 10, during the Asian session, spot gold shock slightly down, and is currently trading near $ 1686 per ounce. Last Friday's better-than-market-expected U.S. non-farm payrolls report for September reinforced expectations that the Federal Reserve will raise interest rates sharply, and the dollar and U.S. bond yields surged and recorded three consecutive positive days, causing gold prices to weaken sharply.

Mohicans markets:Hitting Exhibition| See the Grand Occasion of Dubai Exhibition!
Focus on the industry highlight event, and explore the new future of trading. MHMarkets, the world's leading currency and CFD broker, is committed to providing better trading services to global traders and expanding its international markets.

Mohicans markets :MHM Today’s News
On Thursday, spot gold first fell and then rose. The US market once rose to a high of $1,664.78, and finally closed up 0.04% at $1,660.57 per ounce; spot silver finally closed down 0.34% at $18.82 per ounce.

Mohicans markets:Daily European Market Viewpoint
On Thursday, September 29, during the Asia-Europe period, spot gold fluctuated slightly and was currently trading around $1,652.26 an ounce. U.S. crude oil fluctuated in a narrow range and is currently trading around $81.63 a barrel, holding on to its sharp overnight gains.
WikiFX Broker
Latest News
Forex 101: Welcome to the $7.5 Trillion Beast
Commodities Focus: Gold Pulls Back & Silver targets Retail Traders
Fed Holds Firm: January Rate Cut Hopes Fade Despite Cooling CPI
Oil Surge: WTI Reclaims $60 as Middle East Tensions Override Venezuela Deadlock
TopWealth Trading User Reviews: A Complete Look at Real Feedback and Warning Signs
ThinkMarkets Regulation: Safe Trading or Risky Broker?
ehamarkets Review 2026: Regulation, Score and Reliability
8xTrade Review 2025: Safety, Features, and Reliability
VEBSON Review 2025: Is This Broker Safe or a Potential Scam?
Seacrest Markets Under Fire Over Withholding Salaries and IB Payments
Rate Calc

