Mohicans markets:Rate Hike Expectations Intensify, And Focus on the Evening EIA Data
Abstract:On Wednesday, September 14, the CPI data released last night hardly made a radical change in the pace of Fed rate hikes, but the negative fundamentals still kept gold under pressure below 1710. Crude oil is still dominated by supply and demand with stronger support, and tonight’s EIA data may further disrupt the oil market. This breakdown in CPI expectations also hints at why the dollar has remained strong recently.

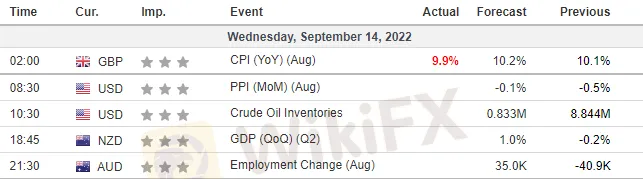
Key Data
Fundamentals overview
On Wednesday, September 14, the CPI data released last night hardly made a radical change in the pace of Fed rate hikes, but the negative fundamentals still kept gold under pressure below 1710. Crude oil is still dominated by supply and demand with stronger support, and tonights EIA data may further disrupt the oil market. This breakdown in CPI expectations also hints at why the dollar has remained strong recently. We expect the dollar to continue to strengthen after the inflation data is released into next week's Fed rate meeting, when the Fed is likely to be very hawkish.
CME did not release futures options-related data today, so todays report is limited to order flow points not updated; The Mohicans Markets strategy is for reference only and not as investment advice. Please read the terms of the statement at the end of the article carefully. The following strategy was updated at 16:30 on September 14, 2022, Beijing time.
Technical View
ONE · Technical Level · International Gold
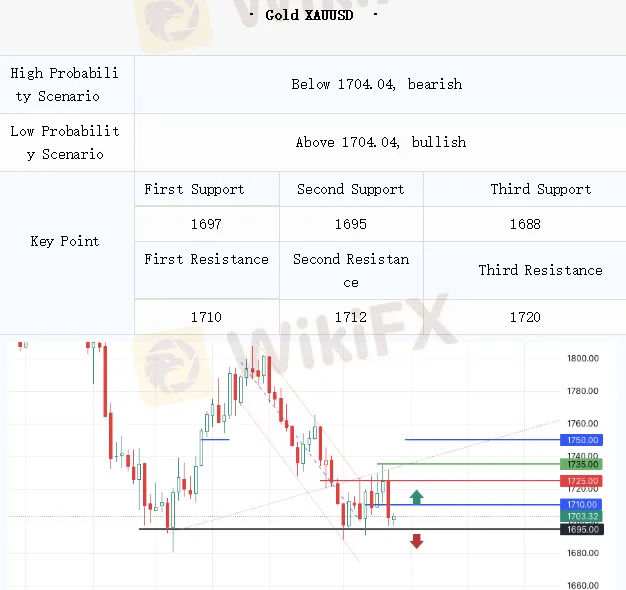
1730 Volume up and down, strong resistance
1720 Resistance
1710-1712 First key intra-day resistance area, the level below the gold price continues to be under pressure
1704 Hourly mid-rail suppression, the first resistance level
1697-1695 First key intra-day support area, the break is expected to look down to 1675-1680
1675-1680 Annual key support area
Technical Analysis
Although the U.S. CP in August released on Tuesday night continued to fall year-on-year (8.3% vs. 8.5% previously), the fall was lower than expected (8.1%), especially the core CPI lift-off was significantly stronger than the market imagined (0.6% vs. 0.3% expected).
This reignited the markets concern that the Fed would have to accelerate tightening, with expectations of a 75bp rate hike in September further reinforced outside of the 100bp hike expected to begin to emerge, and gold suffered a heavy drop. However, ultimately inflation is on the retreat, the Fed's rate hike path and end point is not so radical change because of last night's data, concern about the U.S. bond yields before next week's Fed meeting will be maintained near the previous high. Specifically for gold, gold rebounded after sinking to the long key support area of 1697-1704 overnight, suggesting that there are still some bulls holding on, and the day continues to focus first on the defense of 1697, with a break down to near 1675. On the other hand, under the negative fundamentals, the willingness of the bulls to enter is suppressed, the previous key level of 1710 turned into the first key resistance, gold prices still face downward pressure below this level.
Note: The above strategy was updated at 16:00 on September 14. This strategy is a day strategy, please pay attention to the release time of the strategy.
TWO · Technical level · Spot silver
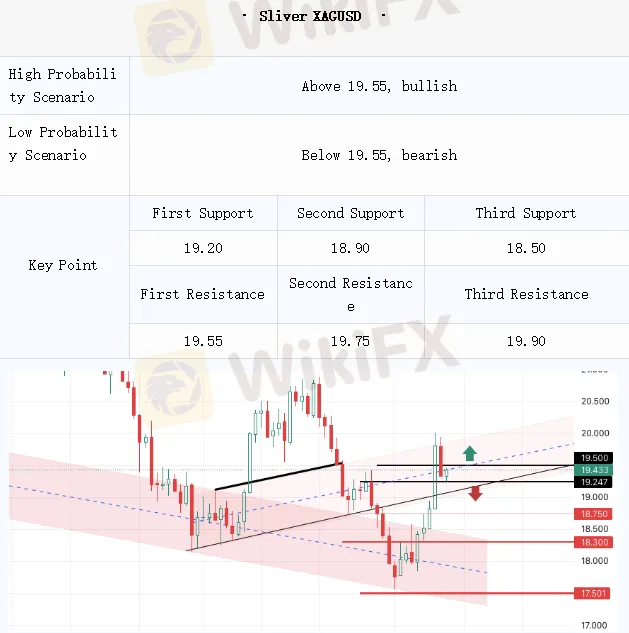
19.9-20 Volume start point, strong resistance area
19.75 Strong resistance
19.55 First key intraday resistance, silver continues to come under pressure at this level
18.9-19.2 Rebound key support area
18.3-18.5 Key support zone (long cost zone)
17.85 Ultimate Support
Technical Analysis
Silver fell back from 19.9 to around 19.3 after the CPI data. Although the retreat was larger than gold, it did not completely erase the previous oversized gains. The gold-silver ratio is in shock near support. However, in a bearish fundamental environment, please be wary of the potential for silver to make up for its losses. In this case, the gold-silver ratio is expected to rebound further, so you can see whether the gold and silver prices will fall further by watching the trend of gold and silver coins (the historical pattern shows that the gold-silver ratio trend is inversely related to the price of gold).
Note: The above strategy was updated at 16:00 on September 14. This strategy is a day strategy, please pay attention to the release time of the strategy.
THREE · Technical Level · US Crude Oil
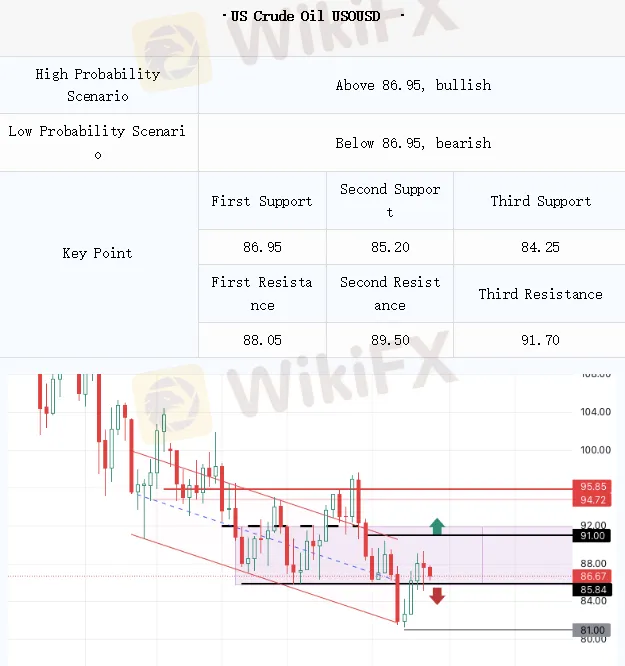
91-91.7 Early strong resistance
89.5 Strong resistance
88 Intraday first resistance
86.6-86.9 First intra-day support area, the long and short boundary
85.2 Key support
84.25 Strong support
82-82.5 Key support area (long cost area)
Technical Analysis
CPI data was released just as WTI crude oil rallied to key resistance around 89.5. CPI data prompted the dollar to move higher, and oil prices were affected by this pullback. However, crude oil as a commodity, its price is still mainly dominated by supply and demand, so oil prices put in a quick rebound after falling back to 85.2 support, with stronger support. Simply put, CPI is only a short-term disturbance to oil prices, and the overall picture still depends on the expected changes in supply and demand. The data released in the early morning showed that crude oil inventories increased but gasoline inventories decreased, indicating that demand is still okay. In addition, there is news that the U.S. may start to restock its emergency oil reserves when crude oil prices fall below $80 per barrel. The news is expected to limit the downside of oil prices. The EIA data will be released tonight, so continue to watch for changes in the inventory data.
Note: The above strategy was updated at 16:00 on September 14. This strategy is a day strategy, please pay attention to the release time of the strategy.
FOUR · Technical level · EUR/USD
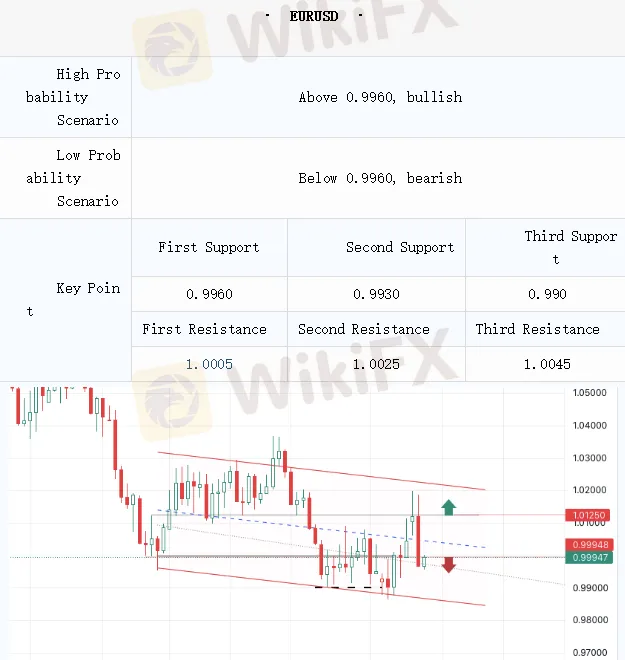
1.0045 bullish decrease, bearish increase, 3rd resistance
1.0025, bullish increase, bearish increase, second resistance level
1.0005. bullish decrease, bearish increase, primary focus on resistance
0.996, bullish increase, bearish decrease, first focus on support level
0.993, bullish increase, bearish unchanged, second support level
0.990, bullish increase, bearish unchanged, third support level
Technical Analysis
Before the European session on Wednesday, the euro fell 0.04% against the dollar. Above, pay attention to 1.0005, 1.0025, and 1.0045 resistance; below, pay attention to 0.996, 0.993, and 0.990 support.
Note: The above strategy was updated at 16:00 on September 14th. This strategy is a day strategy, please pay attention to the release time of the strategy.
FIVE · Technical Level · GBPUSD
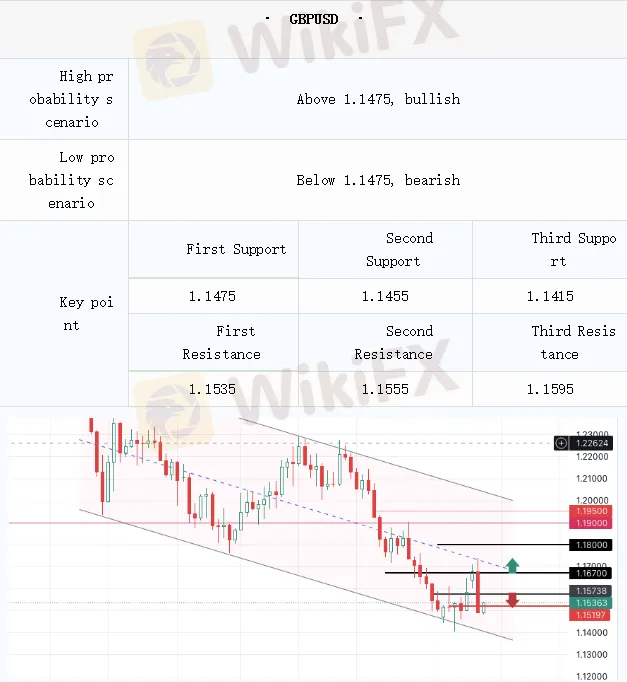
1.1595, bullish decrease, bearish increase, 3rd resistance
1.1555, bullish unchanged, bearish increase, 2nd resistance
1.1535-1.154, bullish unchanged and there is stock, bearish unchanged, long target and resistance
1.1495, bullish unchanged with stock, bearish unchanged, long target
1.1475, bullish increase with stock, bearish increase, support level
1.1455, bullish sharp increase, bearish decrease, support level
1.1415, bullish sharp increase, bearish decrease, support level
Technical Analysis
Before the European market on Wednesday, the pound fell 0.04% against the US dollar. Above, pay attention to the resistance near 1.1535, 1.1555, and 1.1595, and 1.154 is the dominant position; below, pay attention to the support near 1.1475, 1.1455, and 1.1415.
Note: The above strategy was updated at 16:00 on September 14th. This strategy is a day strategy, please pay attention to the release time of the strategy.
SIX · Technical level · AUD/USD
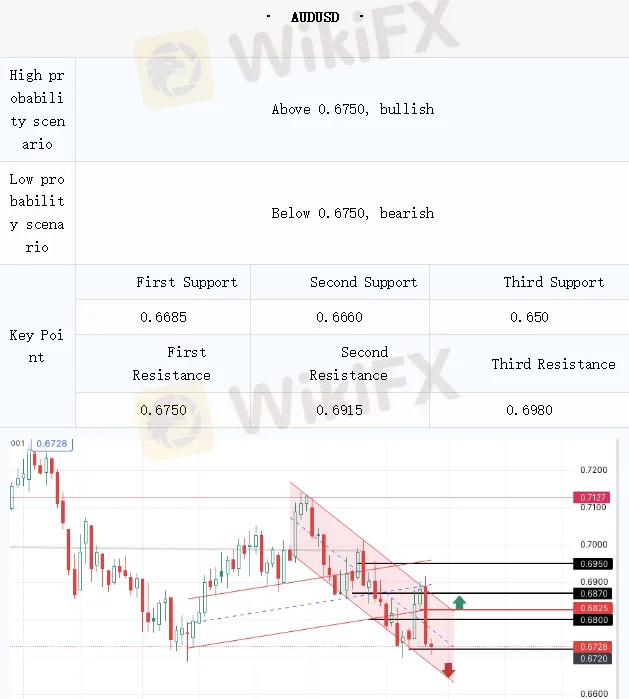
0.7, bullish sharply reduced, bearish unchanged, resistance level
0.698, bullish unchanged, bearish increased sharply, resistance level
0.6915, bullish unchanged, bearish increased sharply, resistance level
0.675 bullish increase, bearish increase, bulls target and resistance
0.6685 bullish decrease sharply, bearish increase sharply, bears target
0.660 bullish increase sharply, bearish decrease, support level
Technical Analysis
Before the European session on Wednesday, the Australian dollar fell 0.04% against the US dollar. Above, pay attention to 0.7, 0.698, 0.6915, and 0.675 resistance; below, pay attention to 0.6685, 0.660 support.
Note: The above strategy was updated at 16:00 on September 14th. This strategy is a day strategy, please pay attention to the release time of the strategy.
Statement | Disclaimer
Disclaimer: The information contained in this material is for general advice only. It does not take into account your investment goals, financial situation or special needs. Mohicans Markets has made every effort to ensure the accuracy of the information as of the date of publication. Mohicans Markets makes no warranties or representations regarding this material. The examples in this material are for illustration only. To the extent permitted by law, Mohicans Markets and its employees shall not be liable for any loss or damage arising in any way, including negligence, from any information provided or omitted from this material.The features of Mohicans Markets products, including applicable fees and charges, are outlined in the product disclosure statements available on the Mohicans Markets website and should be considered before deciding to deal with these products. Derivatives can be risky and losses can exceed your initial payment. Mohicans Markets recommends that you seek independent advice.
Mohicans Markets, (Abbreviation: MHMarkets or MHM, Chinese name: Mai hui), Australian Financial Services License No. 001296777.


Read more

Mohicans markets:European Market
On Monday, October 10, during the Asian session, spot gold shock slightly down, and is currently trading near $ 1686 per ounce. Last Friday's better-than-market-expected U.S. non-farm payrolls report for September reinforced expectations that the Federal Reserve will raise interest rates sharply, and the dollar and U.S. bond yields surged and recorded three consecutive positive days, causing gold prices to weaken sharply.

Mohicans markets:Hitting Exhibition| See the Grand Occasion of Dubai Exhibition!
Focus on the industry highlight event, and explore the new future of trading. MHMarkets, the world's leading currency and CFD broker, is committed to providing better trading services to global traders and expanding its international markets.

Mohicans markets :MHM Today’s News
On Thursday, spot gold first fell and then rose. The US market once rose to a high of $1,664.78, and finally closed up 0.04% at $1,660.57 per ounce; spot silver finally closed down 0.34% at $18.82 per ounce.

Mohicans markets:Daily European Market Viewpoint
On Thursday, September 29, during the Asia-Europe period, spot gold fluctuated slightly and was currently trading around $1,652.26 an ounce. U.S. crude oil fluctuated in a narrow range and is currently trading around $81.63 a barrel, holding on to its sharp overnight gains.
WikiFX Broker
Latest News
Telegram Investment Promises Turn Costly as Civil Servant Loses Nearly RM100,000 in 2 Separate Scams
 WikiFX
TRADEDEAL Review 2026: Unverified Regulation and Warning Signals
WikiFXFM-Fund Review 2026: Unregulated Status and High-Risk Signals
WikiFXOman’s FSA Warns Against Open Gate Trading as Website Claims Regulation
WikiFXBeeMarkets Review 2026: Is it Legit or a Scam? Read This Investigation
WikiFXInflation rate projected to hit 6% in the second quarter, top economic forecasters say
WikiFXOil Crosses $101 On Shipping Blockade
WikiFXCrude Shocks Meet Asian Inflation Surges
WikiFXStrong Dollar Sinks Asian Currencies
WikiFXCFDInterbank Review 2026: Unregulated Offshore Profile and Key Risk Signals
WikiFXRate Calc

