Mohicans markets:October 28- MHM European Perspective
Abstract:On Friday, October 28, Beijing time, spot gold shock slightly down in early trading of Asian market, and is currently trading near $ 1660 per ounce; investors generally wait for the performance of the evening U.S. PCE data for September, the market is expected to maintain the U.S. core annual rate of PCE will rise to 5.2%, which is expected to further give the Federal Reserve next week to raise interest rates by 75 basis points to provide data support, put gold prices under pressure.

Market Overview
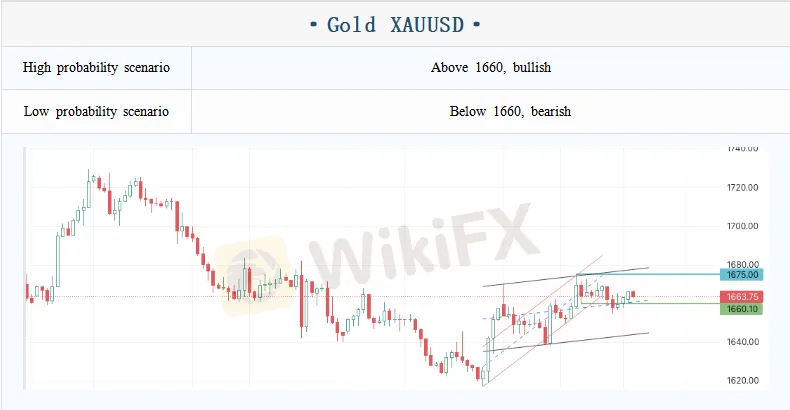
On Friday, October 28, Beijing time, spot gold shock slightly down in early trading of Asian market, and is currently trading near $ 1660 per ounce; investors generally wait for the performance of the evening U.S. PCE data for September, the market is expected to maintain the U.S. core annual rate of PCE will rise to 5.2%, which is expected to further give the Federal Reserve next week to raise interest rates by 75 basis points to provide data support, put gold prices under pressure; however, about the Federal Reserve will slow down the pace of interest rate hikes in December is also expected to further heat up, the U.S. bond yields hovering near the low of nearly two weeks, but also to provide support for gold prices. The last trading day K-line recorded a cross, short term trend variability increased, but still slightly biased towards the long side.
In addition, this trading day also need to pay attention to the performance and impact fermentation of the third quarter GDP data from France and Germany; please pay attention to the U.S. September seasonally adjusted monthly rate of pending home sales index and the European Central Bank officials speech.
Mohicans Markets strategies are for information purposes only and are not intended as investment advice, please read the disclaimer at the end of the article. The following strategies were updated on October 28, 2022 at 15:30 BST.
Technical Analysis
CME Group options layout changes(December Futures Price):
1715 Bullish decrease sharply, bearish unchanged, the second target for Bulls
1700 Bullish increase sharply, bearish increase slightly, long target and resistance
1690 Bullish increase slightly, bearish unchanged, short term resistance
1670 bullish increase sharply, bearish increase slightly, the first target for Bulls, sentiment dividing point between long and short
1660 Bullish increase sharply, bearish increase, first support
1650 bullish increase sharply, bearish decrease, key support
1630 Bullish unchanged, bearish increase and the stock is large, the first target for Bears
Order flow key point marking (Spot Price):
1694-1696 Long target
1682-1684 Medium-term resistance
1672-1673 Key resistance during the day
1657 Short-term support
1650-1652.6 Long-short boundary (trend support during the week)
1645 Short support
1637 Key trend support, break down to return to downtrend
Note: The above strategy was updated at 15:00 on October 28. The strategy is a daytime strategy, please note the strategy release time.
CME Group options layout changes(December Futures Price):
20 Bullish increase and the stock is large, bearish unchanged, long target and resistance
19.75 Bullish increase slightly, bearish unchanged, long target
19.5 Bullish increase, bearish increase slightly, long and short compete for points
19.45 Bullish increase slightly, bearish increase, downward momentum expand
19.2 Bullish unchanged, bearish decrease slightly, weak support
19 Bullish increase slightly, bearish increase, short target and support
18.5 Bullish decrease slightly, bearish decrease slightly, support level
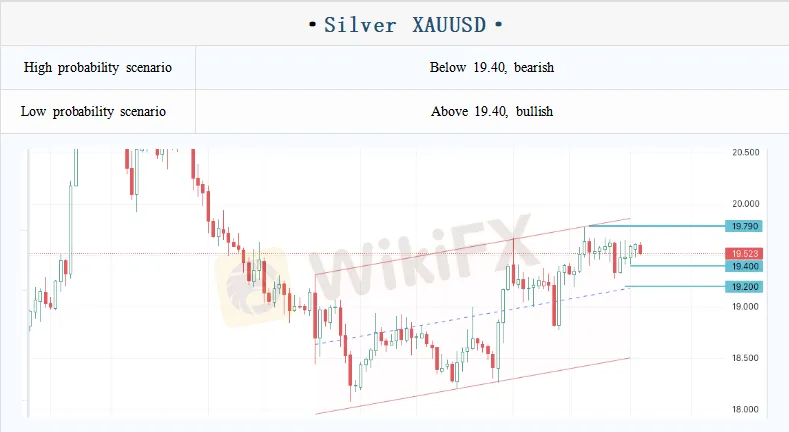
Order flow key point marking (Spot Price):
19.9-20 Trend key resistance
19.7 Resistance during the day
19.33-19.42 Short-term key support
19.23 Short-term support (weak)
18.9-19 Key support during the week
18.6 Short-term support
18-18.3 Important support area
Note: The above strategy was updated at 15:00 on October 28. The strategy is a daytime strategy, please note the strategy release time.
Key point marking of order flow (futures price in December):
95 Bullish sharply reduced, but the stock was large, and bearish slightly reduced, with strong resistance
90 Bullish sharply reduced, but stocks were large, bearish increased, resistance level
89 Bullish sharply reduced, bearish sharply increased, the first resistance level
87 Bullish increased, bearish increased, support level
85 Bullish is unchanged, but stocks were large, bearish increased significantly, short target and support position
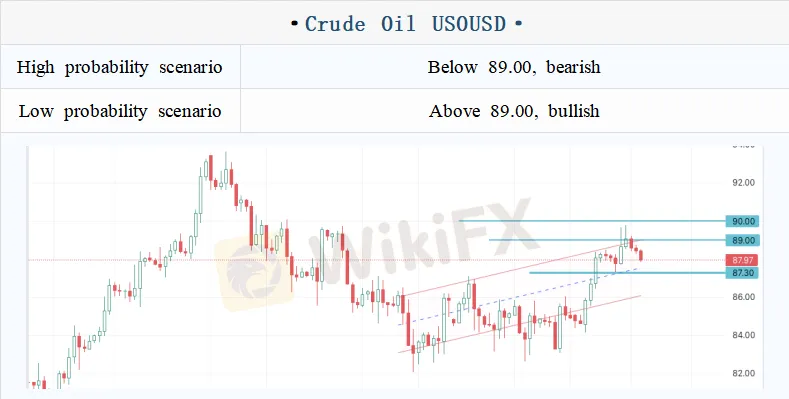
Key point marking of order flow :
93.5 Strong resistance
91.6 Second resistance
89.8-90 First resistance
88.6 Key position of Asian market
87-87.4 Key support
86 Second support
Note: The above strategy was updated at 15:00 on October 28. This policy is a daytime policy. Please pay attention to the policy release time.
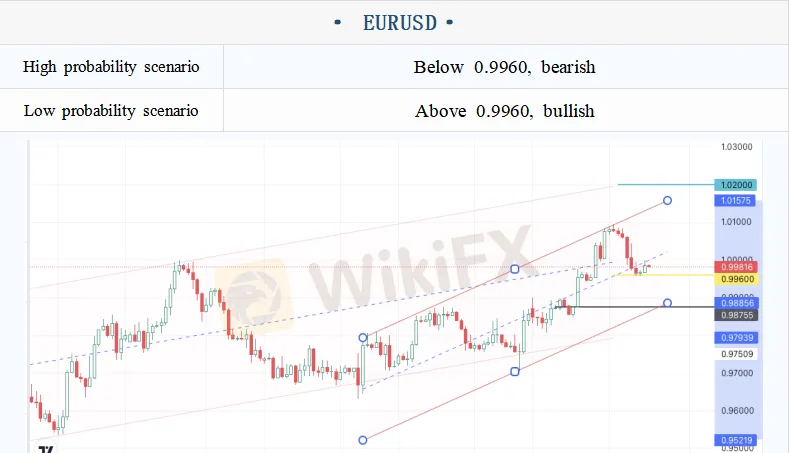
Changes of CME Group's option layout:
1.01 Bullish increased and large stock, bearish decreased slightly, long target
1.005 Bullish increased significantly, bearish increased, rebound target and resistance
1.00 Bullish increased significantly, bearish decreased but stocks were large, rebound target
0.995 Bullish slightly increased, bearish slightly decreased, support level
0.99 Bullish slightly increased, bearish significantly increased and stocks were large, short target
0.985 Bullish unchanged, bearish decreased but the stock was large, and the short target and supports
Note: The above strategy was updated at 15:00 on October 28. This policy is a daytime policy. Please pay attention to the policy release time.
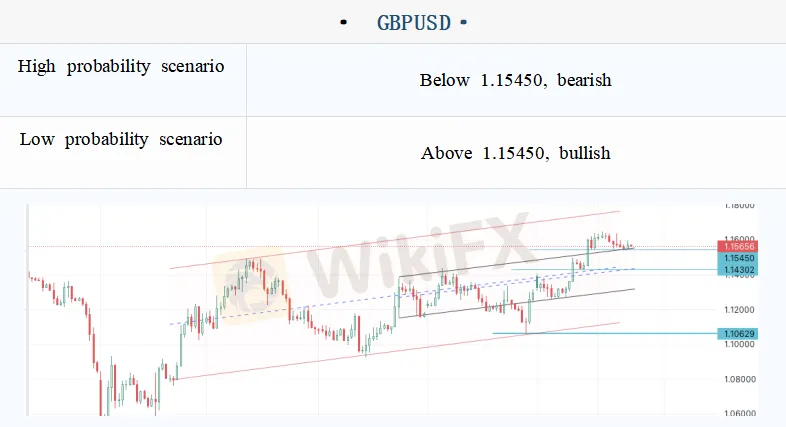
Changes of CME Groups option layout:
1.17 Bullish increased but stock was large, bearish decreased unchanged, long target
1.165 Bullish unchanged but stock was large, bearish unchanged, rebound target
1.16 Bullish decreased slightly, bearish increased slightly, the first resistance
1.155 Bullish unchanged but stock was large, bearish unchanged, support level
1.15 Bullish unchanged but stock was large, bearish increased slightly, rebound target and support
1.145 Bullish unchanged, bearish increased, long target
1.14 Bullish increased slightly, bearish increased, the next short target
Note: The above strategy was updated at 15:00 on October 28. This policy is a daytime policy. Please pay attention to the policy release time.
Statement | Disclaimer
Disclaimer: The information contained in this material is for general advice only. It does not take into account your investment goals, financial situation or special needs. Mohicans Markets has made every effort to ensure the accuracy of the information as of the date of publication. Mohicans Markets makes no warranties or representations regarding this material. The examples in this material are for illustration only. To the extent permitted by law, Mohicans Markets and its employees shall not be liable for any loss or damage arising in any way, including negligence, from any information provided or omitted from this material.The features of Mohicans Markets products, including applicable fees and charges, are outlined in the product disclosure statements available on the Mohicans Markets website and should be considered before deciding to deal with these products. Derivatives can be risky and losses can exceed your initial payment. Mohicans Markets recommends that you seek independent advice.
Mohicans Markets, (Abbreviation: MHMarkets or MHM, Chinese name: Mai hui), Australian Financial Services License No. 001296777.


Read more

Mohicans markets:MHM European Market
Spot gold weakened slightly during the Asian session on Thursday (April 6), hitting a two-day low of $2007.89 per ounce and now trading near $2014.15. A series of weak economic data has fueled fears of an impending recession in the US, giving safe-haven support to the dollar. And some dollar shorts took profits, and gold bulls also took profits ahead of Good Friday and the non-farm payrolls data, putting pressure on gold prices.

Mohicans markets:MHM Today News
On Wednesday, as the less-than-expected March "ADP" data and non-manufacturing PMI data fueled market concerns about an economic slowdown and spurred bets that the Federal Reserve could slow interest rate hikes. Spot gold continued to brush a new high since March last year, which was the highest intraday to $2032.13 per ounce, and then retracted most of the day's gains, finally closing up 0.01% at $2020.82 per ounce; spot silver hovered around $25 during the day, finally closing down 0.21% at $2

Mohicans markets:MHM European Market
Spot gold oscillated slightly lower during the Asian session on Tuesday (April 4) and is currently trading around $1980.13 per ounce. The dollar index rebounded mildly after a big drop overnight, putting pressure on gold prices. However, this week will see the non-farm payrolls report, there is no important economic data out on Tuesday, and the market wait-and-see sentiment is getting stronger.

Mohicans markets :MHM Today News
On Monday, in OPEC + members unexpectedly cut production reignited market concerns about long-term inflation and sparked uncertainty about the Fed's response, the dollar index once up to the 103 mark, and then on a "vertical roller coaster", giving back all the gains of the day and once lost 102 mark, finally closed down 0.53% at 102.04; U.S. 10-year Treasury yields rose and then fell, as data showed that the U.S. economy continues to slow, it fell sharply in the U.S. session, and once to a low
WikiFX Broker
Latest News
eToro Review 2026: Regulatory Lawsuits, Clone Scams, and Withdrawal Complaints
 WikiFX
Why Betting Your Entire Account Triggers Early Margin Calls
WikiFXFed dissenters explain 'no' votes, saying they disagreed with hinting next move would be a cut
WikiFXSVSFX Review 2026: Revoked Regulation and Critical Risk Signals
WikiFXUK exports to U.S. plunge by 25% after Trump's 'liberation day' tariffs blitz
WikiFXRate Calc

