Breaking: Covering losses mainly in Q4 for Nasdaq
Abstract:Q4, or the fourth quarter, is the last quarter of the financial year for companies. Let's look at some Q4 Review of Nasdaq. The Nasdaq 100 (symbol ‘USTEC’) has started a general upward movement in the beginning of the last quarter of the year trading in a bullish wedge formation. Price respected the boundaries of the wedge until now with the index losing about 2% of its points after the FED meeting and the announcement of a double hike in interest rates.

Q4, or the fourth quarter, is the last quarter of the financial year for companies. Let's look at some Q4 Review of Nasdaq. The Nasdaq 100 (symbol ‘USTEC’) has started a general upward movement in the beginning of the last quarter of the year trading in a bullish wedge formation. Price respected the boundaries of the wedge until now with the index losing about 2% of its points after the FED meeting and the announcement of a double hike in interest rates.
‘Traders will be turning their attention more on economic indicators in January since inflation and monetary policy are not really on the agenda for the next month since the next FED meeting will be held on 1st of February,’ said Antreas Themistokleous, an analyst at Exness.

On the technical perspective the price has been trading in an ascending wedge formation for the last quarter and currently is at a major support area which consists of the lower boundary of the formation, the 100 day moving average and the 50% of the daily Fibonacci retracement level.
With Stochastic indicator near the oversold level and with the critical support level that is currently trading we might see a correction to the upside in the following days with the first point of resistance laying around the 11,955 area just below the 61.8% of the Fibonacci retracement level.
If we witness a valid break below the lower boundary of the wedge formation then we might see some support around the 11,400 area which consists of an area that combines the lower band of the Bollinger bands, the 50 day moving average and also the 38.2% of the daily Fibonacci retracement level.


Read more
IUX Review:Before Investing a Single Penny, Read These Jaw-Dropping Deposit & Withdrawal Experiences
IUX, despite having an operational presence for approximately a decade, continues to face allegations from users regarding its several trading aspects. These include complaints on withdrawal processing, deposit failure, and even wide slippages that eat into users’ margins. For some, withdrawals were never executed, for others, withdrawal processing remained only on paper. On the other hand, some’s deposits fail to show on the IUX login even after 45 days of the transaction initiation date. Concerned by these seemingly suspicious trading incidents, users hit out on several review platforms such as WikiFX. This IUX review examines these user allegations while providing a regulatory framework the broker adheres to.
ForexDana Review 2026: Traders Report Losses—But What Happened Behind the Trades?
A brokerage operation history of over six years without any clarity of the accounts offered. This stunning fact allegedly applies to ForexDana. While this has been a major concern on the transparency front, user experiences concerning suspicious deposit failures and trade manipulation have not been good for the broker’s reputation either. In this ForexDana review, we have attempted to find the reason behind the growing user frustration, not only through their complaints but also what possibly could have led to these complaints. Yes, you heard it right! We are going to probe the ForexDana regulation status. This will help you make the right financial decision.
Saxo Exposure Report 2026: Withdrawal Delays and Transfer Disputes Leave Traders Concerned
As you look forward to reading the Saxo reviews, you come across both positive and negative user experiences concerning trading. However, what makes prospective users dwell more is the significant insight shared through negative experiences compared to positive ones. The negative experiences are more detailed around fund withdrawals and deposits. Although they are allegations, they represent a disturbing picture. For example, we came across a case where a user highlighted the inability to trade an instrument, which is actively traded in the market. We have examined the recent allegations against the brokerage firm in this in-depth review. At the same time, we have provided a thorough look into the broker’s regulatory framework
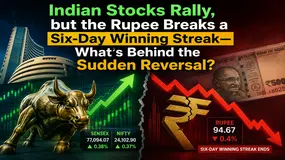
Indian Stocks Rally, but the Rupee Breaks a Six-Day Winning Streak—What's Behind the Sudden Reversal
Indian stock indices today, i.e., June 22, 2026, recorded growth, with the BSE Sensex rising 297.11 points to 77,094.07, recording a 0.38% jump. On the other hand, the NSE Nifty hit approximately 24100, largely aided by broad-based purchases across sectors, except for consumer durables and fast-moving consumer goods (FMCG). The Nifty grew by 89.80 points (0.37%+) to 24,102.90.
WikiFX Broker
Latest News
EMAR MARKETS Review 2026: Complaints, High Leverage, and Withdrawal Risk Signals
 WikiFX
EMIRAX MARKETS Review 2026: Unregulated Status, High Leverage, and Withdrawal Complaints
WikiFXHow the Bullet Theory Fixes the Habit of Overtrading
WikiFXReview 2026: Interactive Brokers Regulation, Complaints, and Platform Access
WikiFXReview 2026: STMARKET Regulation, MT5 Access, and Withdrawal Complaint
WikiFXOver 100 Malaysian Retirees Gather to Expose How Investment Scams Wiped Out Their Life Savings
WikiFXSquaredFinancial Review 2026: Heavy Complaints, Withdrawal Delays, and Profit Deletions
WikiFXUbuntu Invest Review 2026: Is This Forex Broker Safe?
WikiFXVonway Forex Review 2026: Withdrawal Complaints, Regulation Warnings, and Account Risks
WikiFXStructuring a Practical Forex Trading Plan and Stop-Loss Strategy
WikiFXRate Calc

