How to read forex trading charts
Abstract:A forex chart shows you the exchange rate between two currencies and how it has changed over time. If you’re just getting into forex trading, learning to use these charts will help you understand the markets. Charts are the main tools for technical analysis. Charts are using to plot a sequence of prices and price movements of an asset on certain of duration.
A forex chart shows you the exchange rate between two currencies and how it has changed over time. If youre just getting into forex trading, learning to use these charts will help you understand the markets. Charts are the main tools for technical analysis. Charts are using to plot a sequence of prices and price movements of an asset on certain of duration.
It is just a graphical way of showing how the stock prices have performed. Chart has an x-axis called horizontal axis and a y-axis called vertical axis. Generally y-axis represents the price and the x-axis represents the time. A chart always represents the history of the volume of trading in an asset.
Types of Charts
Forex charts come in different forms, but the three most popular types of chart are line charts, bar charts and candlestick charts. Heres what you need to know about each of them. Also In chart, asset price comes such as stock, currency pair, commodity like so on in many varieties. It helps to understand in a quick way for individual traders or investors to choose one type over another. Charts are used for the following purpose:
• Comfort and Familiarity
• User-friendly and quickly identified
• Underlying purpose
Let's discuss the three different types of charts.
Tick Charts
Tick charts have a data point which drawn every time while the market moves or ticks. It means there is no certain time axis to a tick chart; it is just a short term trader just focus on the price action. In the tick chart you will see red line and blue line, red line shows the offer side similarly a blue line indicates the bid side of the market.
Suppose, when you want to take a look at a tick chart on MT 4, and MT 5, you could do double-click on the relevant currency pair in the Market Watch window to see details.
Point and Figure Charts
This is one of the best popular charts in forex trading that has allows:
• to filter exchange rate moves,
• identify clear support and
• Resistance levels as well as trade specific patterns.
This chart allows traders to focus purely on the exchange rate action. Moreover, point and figure charts are typically constructed on graph paper by using an X axis to fill a rising column of boxes and an O to fill a falling column of boxes. Every box represents a specified value that the exchange rate has to attain to justify marking an X or an O on the graph.
Line Charts
The line chart is the most basic of all chart types. It simply connects the closing prices of periods with a line, and doesnt take into account the opening, high, or low price as bar or candlestick charts do. These types of charts mostly used in closing prices and they also could be drawn through high as well as low prices or opening prices instead. A line chart has an x-axis with fixed time intervals.
Bar Charts
A bar chart more resembles a candlestick chart, with the main difference being that a bar chart has no solid body like a candlestick. It shows the opening, high, low, and closing price of a period. The high and the low lines are connected with a vertical line with a small horizontal dash is shown at the open level protruding to the left. The closing level is shown by a horizontal dash to the left side. However bar charts have fixed intervals on the x- axis.
It is useful for identifying exchange rate gaps with the range of the first time period does not overlap that of the upcoming period.
Candlestick Charts
Candlestick charts invented by Japanese that offers more information than a bar chart because the color of the candles body signifies when the market increase or decrease in a particular time period.
Take an example, suppose a white body can be used to show a rising or bullish candle whereas a black body can be used to show a falling or bearish candle. The vertical lines are goes between the low and the open and between the close and the high are called “wicks”. Apart from that, some candles have long wicks and others have short wicks and this could be better half when we predicting subsequent behavior in the forex market. Candlesticks charts have predictive value and may be considered chart patterns in their own right so that many of them have colorful names like doji, hanging man, the hammer as well as shooting star.
What is the chart pattern to use when trading?
Chart patterns are important tool for traders that are utilized as part of traders technical analysis. Chart patterns play an integral part while you are looking for market trends and predicting movements for all like new comers as well as professionals. Traders are analyzed markets such as forex, shares, commodities and more.


Read more
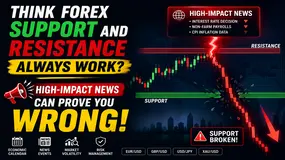
Think Forex Support and Resistance Always Work? High-Impact News Can Prove You Wrong!
Forex traders often have to come to terms with these two popular concepts - Support and Resistance. A support level refers to the point where buyers have historically come together to prevent the price from sliding further. On the other hand, the point of resistance is where sellers have historically limited upward movement. These two levels form the foundation of many trading strategies employed by traders to spot entry, exit and stop-loss points. However, many beginners begin to think that these price levels are unbreakable. Such assumptions can go horribly wrong during high-impact economic news releases such as inflation reports, employment data, monetary policy announcements by the central bank or any other major news events. These events can trigger price movements so much that even the strongest support and resistance levels can crack within seconds.

Centinary Review 2026: I Earned $496,000, but Was I Able to Receive It? Read This Report!
Centinary, a new age broker, has managed to receive quite a bit of user reviews recently. However, all these reviews accuse the broker of robbing users’ funds. From loss of yuan to dollar, traders have been complaining about the alleged hassles faced while withdrawing funds from the Centinary platform. In this Centinary review article, we will take you through the complaints users have made in 2026.
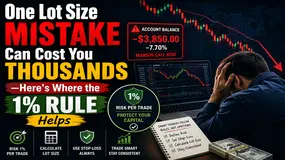
One Lot Size Mistake Can Cost You Thousands—Here's Where the 1% Rule Helps
Switched from one trading strategy to another but could not avert heavy losses? Wondering what went wrong despite your market analysis being spot on? It may not be a strategic issue then. It may just be that you chose the wrong lot size. Yes, a single oversized position can get your account exposed to far greater risks than you may imagine. You may be moved by the impressive profits with increasing lot sizes. But by doing so, you also invite a proportionate rise in losses. This is where you need to apply the essential 1% risk management principle. This rule helps you assess how much you can afford to lose if a trade does not go as planned.

TRANS X MARKETS Review 2026: I Lost as Much as $40K. One of Many Verified User Allegations
This allegation representing fund loss worth $40,000 came from a verified Indian user on a trusted platform such as WikiFX. However, this is not the only allegation from users across India and other regions. Many verified users have complained about the loss of access to withdraw profits from the TRANS X MARKETS platform. At the same time, we came across complaints about the withdrawal issue from the free software provided by the brokerage firm. In this TRANS X MARKETS review, we have examined these allegations while also giving you the company’s regulatory background.
WikiFX Broker
Latest News
'Funflation' hits home: Why staying in isn't the cost-saver it used to be
 WikiFX
Rate Calc

