FPG XAUUSD Market Report October 1, 2025
Abstract:Gold hit a new all-time high at 3,871 before facing a sharp correction that dragged prices quickly down to 3,793 (red rectangle). After this significant drop, buyers re-entered the market, helping pri

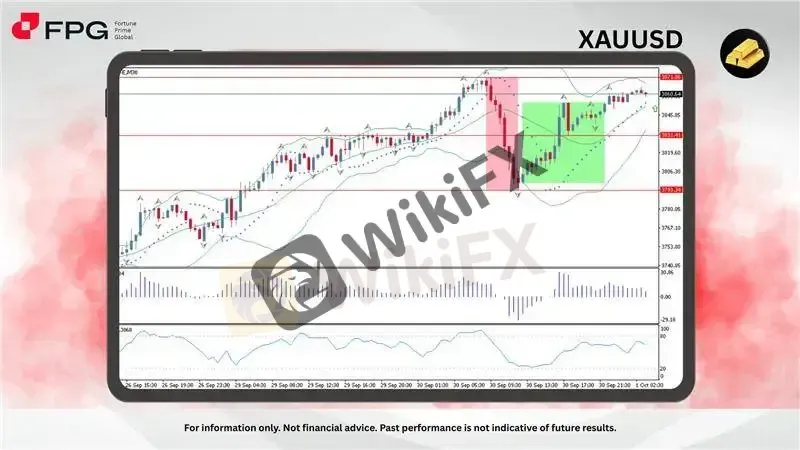
Gold hit a new all-time high at 3,871 before facing a sharp correction that dragged prices quickly down to 3,793 (red rectangle). After this significant drop, buyers re-entered the market, helping prices to recover and form a gradually rising trendline (green rectangle), now stabilizing around the 3,860 area.
From a technical perspective, the Bollinger Bands show prices bouncing from the lower band and now consolidating closer to the upper band, signaling recovering bullish momentum. The Parabolic SAR has shifted below the price, confirming an upward bias. Meanwhile, the Money Flow Index (MFI) is around 63, suggesting renewed buying pressure without yet reaching extreme overbought levels. Support is seen at 3,831 and 3,793, while resistance is defined at the previous high of 3,871.
This extreme price movement underscores the influence of uncertain global economic fundamentals, the US Feds ongoing stance to keep the dollar firm, and persistent geopolitical tensions across different regions. These factors continue to fuel safe-haven demand for gold, likely keeping volatility elevated while sustaining a broader bullish bias.
Market Observation & Strategy Advice
1. Current Position: Gold is trading around 3860 after a sharp correction from its all-time high of 3871, with a gradual recovery underway.
2. Resistance Zone: Immediate resistance is at 3871 (all-time high). A breakout above this level could open the path toward 3900.
3. Support Zone: Key support lies at 3831, followed by stronger protection at 3793 in case of deeper pullbacks.
4. Indicators: Bollinger Bands suggest price is consolidating near the upper band, indicating bullish momentum is regaining strength. Parabolic SAR is aligned below the price, supporting an upward bias. The Money Flow Index (MFI) at 63 signals healthy buying pressure but not yet overbought, keeping room for further upside.
5. Trading Strategy Suggestions:
Bullish Continuation: A breakout above 3871 may trigger fresh upside momentum toward the 3900 psychological level.
Buy on Dips: Pullbacks into the 3831–3793 support zone could provide favorable re-entry opportunities within the broader uptrend.
Risk Management: Monitor overbought signals; set stop-losses below 3793 to manage downside risks in case of sharp reversals.
Market Performance:
Precious Metals Last Price % Change
XPTUSD 1,590.32 −0.12%
XAGUSD 46.7239 +0.18%
Today's Key Economic Calendar:
JP: Tankan Large Manufacturers Index
EU: Inflation Rate YoY Flash
US: ISM Manufacturing PMI
Risk Disclaimer This report is for informational purposes only and does not constitute financial advice. Investments involve risks, and past performance does not guarantee future results. Consult your financial advisor for personalized investment strategies.
WikiFX Broker
Latest News
Mitrade Arabic Platform Targets MENA Gold Trading Boom
Israeli Arrested in Rome Over €50M Forex Scam
New FCA Consumer Alert 2025: Important Warning for All Consumers
EmiraX Markets Withdrawal Issues Exposed
Global Guide to Finding Forex IBs/Brokers — Share Your Pick and Win Big!
Consob Targets Political Deepfake “Clone Sites” and Unlicensed Platforms in Latest Enforcement Round
WikiEXPO Global Expert Interviews: Gustavo Antonio Montero: ESG in Finance
Trump tariffs are helping drive U.S. beef prices to new highs
Scam Alert: GINKGO-my.com is Draining Millions from Malaysians!
Trading Pro Review: Scam Broker Exposed
Rate Calc


