A Market Gripped by Heightened Volatility
Abstract:Cryptocurrencies once again became the epicenter of losses yesterday, reflecting a broadly fragile risk sentiment across global capital markets. Precious metals, including gold and silver, saw renewed
Cryptocurrencies once again became the epicenter of losses yesterday, reflecting a broadly fragile risk sentiment across global capital markets. Precious metals, including gold and silver, saw renewed sell-offs that caught market attention, while equities were dragged lower in tandem. At present, financial markets are clearly entering a deleveraging phase, during which investors are actively reducing exposure and compressing risk to more manageable levels.
During yesterdays live session, we highlighted that the economic cycle is currently approaching the late expansion phase. Historically, capital markets at this stage are characterized by sharp rallies followed by equally abrupt corrections. As volatility intensifies, such price swings should be viewed as an inherent feature of the economic cycle rather than an anomaly. Over the past year, gold and silver have surged by more than 90% and 290%, respectively. The current pullback is therefore largely a function of the prior outsized gains. When upside momentum is driven primarily by sentiment, a rapid and disorderly correction becomes an anticipated outcome rather than a surprise.
Investor sentiment this week has shifted decisively from greed to fear. Consistent with our long-held framework, we believe that when the Fear & Greed Index falls below the 40 threshold, investors should begin monitoring opportunities associated with medium-term equity pullbacks.
S&P 500 declined from its recent high of 6,978.60 to 6,798.40 (−2.58%)
NASDAQ Composite retreated from 23,461.82 to 22,540.59 (−3.93%)
Dow Jones Industrial Average eased from 49,590.20 to 48,908.72 (−1.37%)
While index-level drawdowns remain contained within 5%, well below the technical correction threshold of −10%, volatility among select mega-cap technology stocks, notably Nvidia and Alphabet, has increased meaningfully in recent sessions.
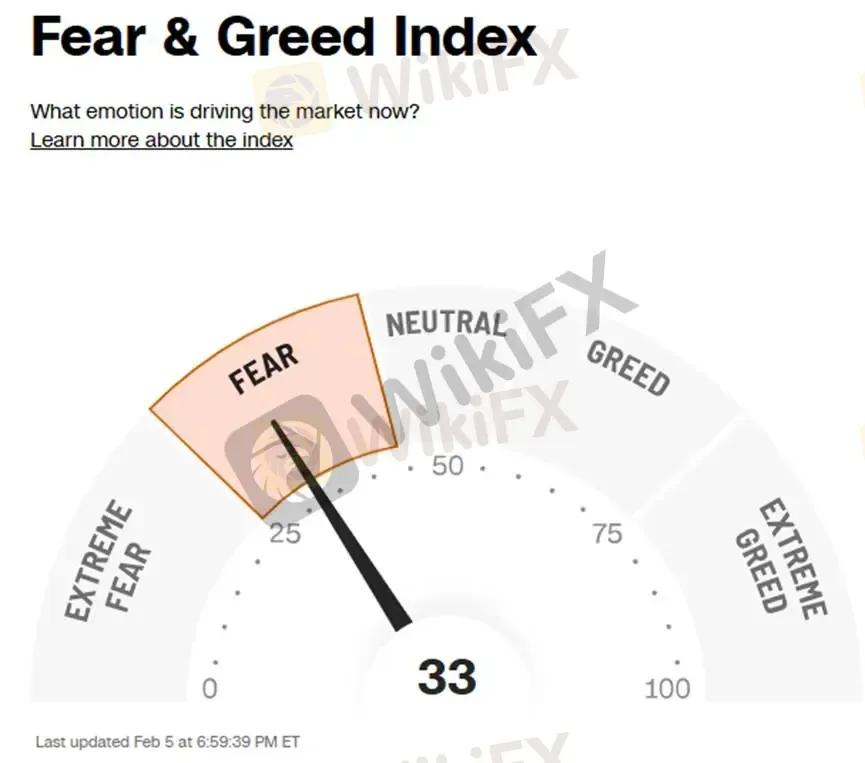
(Figure 1: Fear & Greed Index | Source: CNN)
According to the latest Q4 2025 earnings analysis released by John Butters, Senior Analyst at FactSet, the S&P 500 currently exhibits a dual dynamic of strong earnings resilience alongside elevated valuation levels.
2026 Outlook
Analysts remain constructive on profit margin expectations across all quarters of 2026, with full-year net margins projected to range between 13.2% and 14.2%.
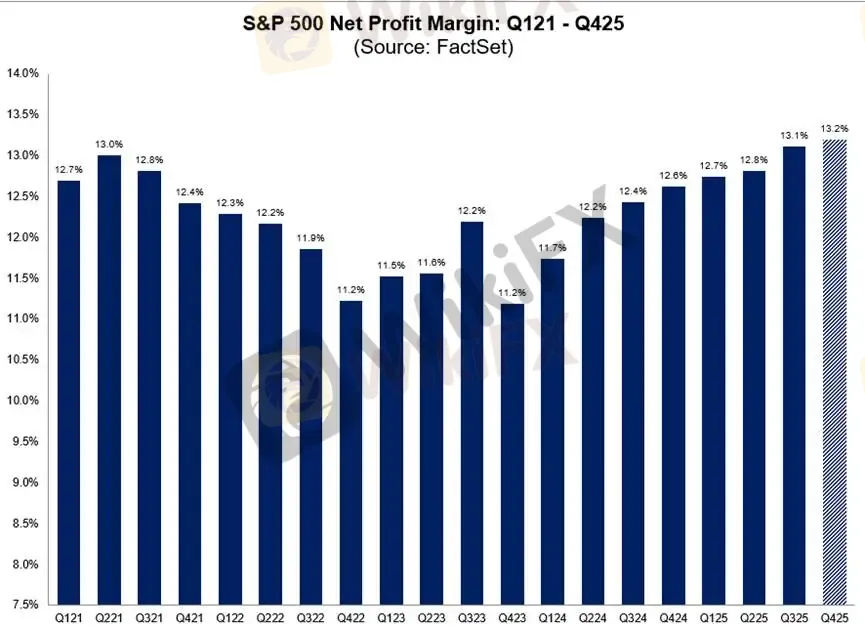
(Figure 2: Estimated Q4 Net Profit Margin at 13.2%, Maintaining Double-Digit Growth | Source: FactSet.com)
The core bullish thesis for equities rests on the principle that high growth justifies high price-to-earnings multiples. As long as growth momentum remains intact, attempting to call a structural trend reversal based solely on valuation metrics represents a flawed analytical approach. While elevated U.S. equity valuations are widely acknowledged, investors often underestimate the degree to which sustained high growth can support higher multiples. As the economic cycle advances deeper into its expansion phase, relying on valuation as a prerequisite for market participation may significantly limit investment opportunities going forward.
Gold Technical Analysis
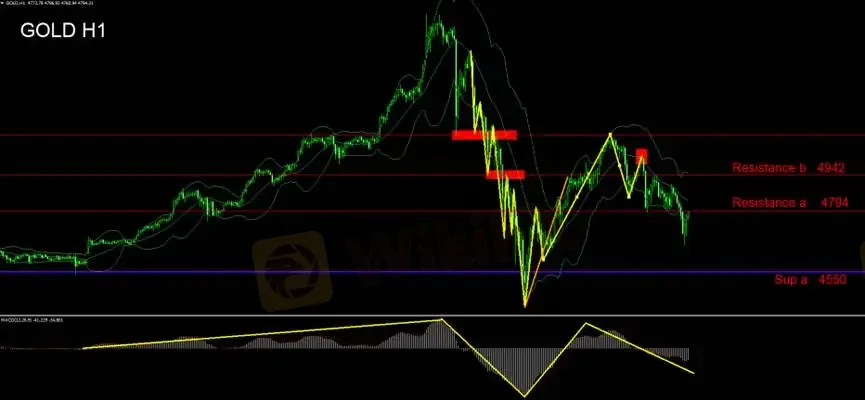
Building on yesterdays technical focus, we continue to assess gold through the lens of Bollinger Bands. The current downward expansion of the bands confirms a bearish configuration, suggesting that recent price action represents a continuation of the broader downtrend following a failed rebound.
The decline has exhibited a consistent structure: rebounds have repeatedly stalled near the midline of the Bollinger Bands, followed by renewed downside pressure. Lower highs and progressively lower lows remain intact, with attention now shifting to the prior support zone near 4550.
Momentum indicators further reinforce this view. As outlined previously, the MACD histogram continues to expand into negative territory, lending support to short-side positioning.
During todays Asian session, prices briefly touched 4663 before rebounding. Investors should closely monitor resistance at the Bollinger midline. A decisive break above this level would warrant a neutral, wait-and-see stance.
Given current conditions, the market environment is more suitable for intraday trading, and we recommend avoiding overnight positions.
Support Levels
Support A: 4550
Resistance Levels
Resistance A: 4794
Resistance B: 4942
Risk Disclosure:
The views, analyses, research, prices, and other information provided above are intended solely for general market commentary and do not represent the official position of this platform. All readers assume full responsibility for their own investment decisions and associated risks. Please exercise caution when trading.

WikiFX Broker
Latest News
Vonway Forex Review: No Regulation, Withdrawal Complaints, and a Broker Warning
 WikiFX
Rupee Logs Quarterly Gain; Yen Hits 40-Year Low
WikiFXFinalto Review 2026: Regulation, Trading Environment, and Platform Access Risks
WikiFXWHITEFOREX Review 2026: I Am Not the Only Victim of Its Profit Seizure Activity; Users Say This!
WikiFXBelgium’s FSMA Flags 25 Fraudulent Trading Platforms
WikiFXEPFX Review 2026: Should You Trade with This Broker?
WikiFXCash Trust Scheme Cost 1,800 Victims More Than RM100 Million
WikiFXTHEFALCON MARKETS Review 2026: Is This Forex Broker Safe?
WikiFXVietnam Becomes New Base for Cross Border Scam Syndicates After Cambodia Crackdown
WikiFXZhida Review 2026: Is This Forex Broker Safe?
WikiFXRate Calc

