2024-12-16 16:22
IndustryGold/USD: Trading Strategy and Outlook
Recent Price Action
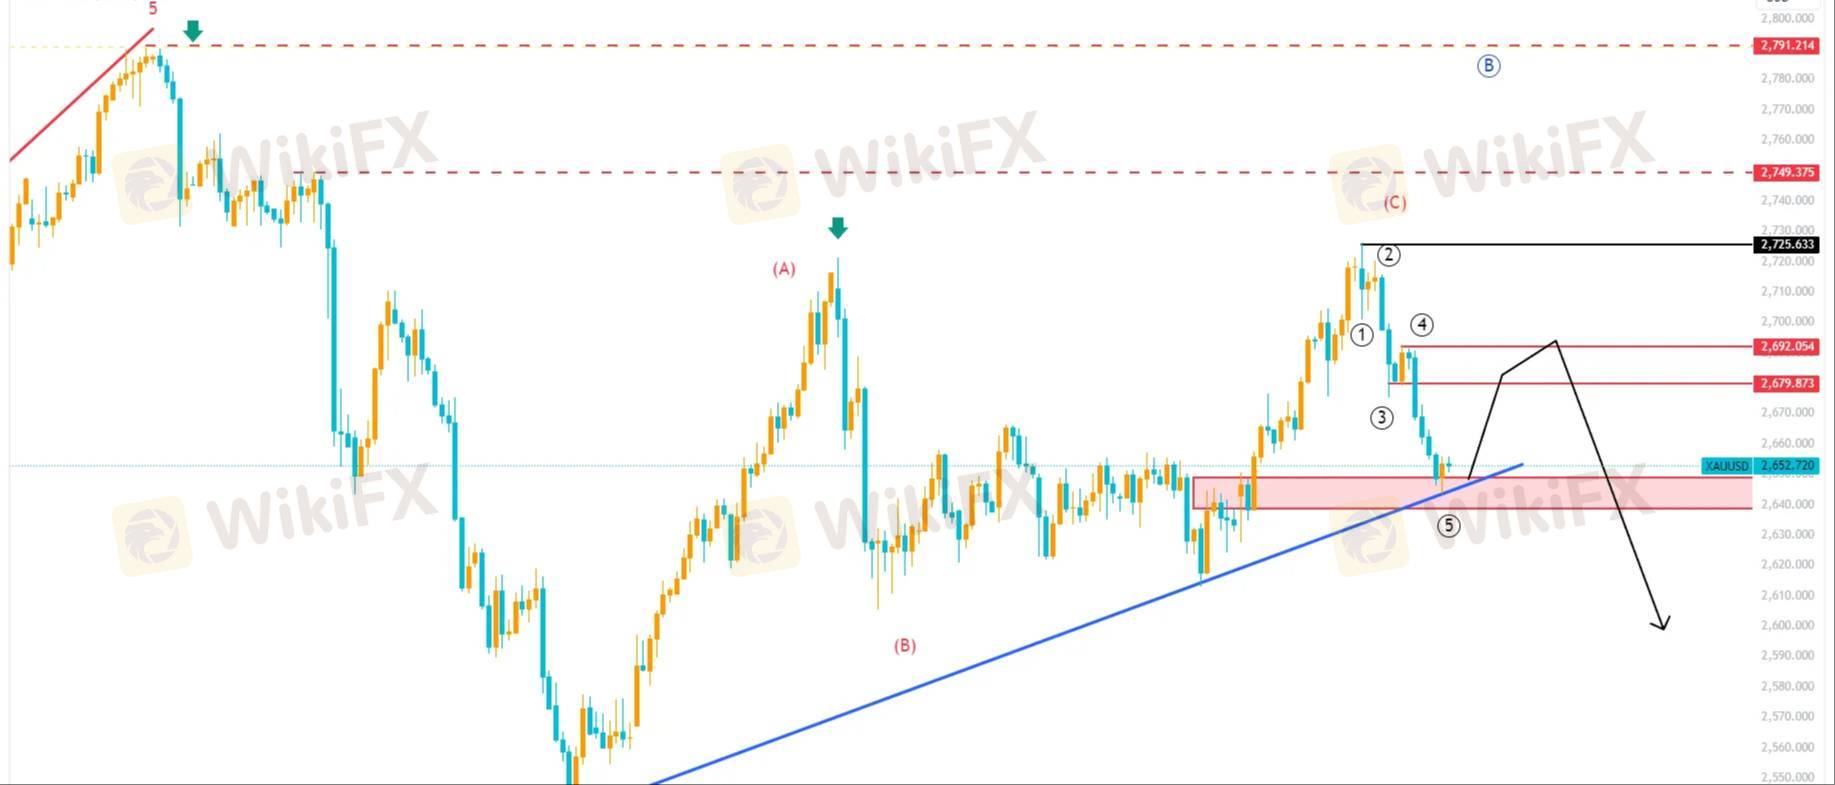
Gold broke below $2680 on Friday, dropping to $2648. The immediate support is expected around $2600.
Short-Term Outlook
In the near term, gold is likely to range between $2600-$2750. If $2600 holds as support, expect a period of fluctuation within this range.
From the daily chart, gold is currently hovering near the $2650 support level. A potential rebound could see prices testing $2680 and, if broken, $2700 would act as the next resistance level. Additional upside could revisit the recent high of $2725.
Bearish Scenario
If the daily chart closes below the 21-day moving average at $2640, gold may retest the December 6th low at $2613. The final support for buyers is at $2600.
Trading Strategy
Sell Entry: Consider selling at the upper boundary of the $2680–$2630 range.
Stop Loss: Set a strict stop loss at $10 below the entry point.
Target: Aim for the lower boundary of the range.
If $2640 holds, expect a potential rebound first, with further downside only if $2600 is broken.
Like 0
Kevin Cao
Trader
Hot content
Industry
Event-A comment a day,Keep rewards worthy up to$27
Industry
Nigeria Event Giveaway-Win₦5000 Mobilephone Credit
Industry
Nigeria Event Giveaway-Win ₦2500 MobilePhoneCredit
Industry
South Africa Event-Come&Win 240ZAR Phone Credit
Industry
Nigeria Event-Discuss Forex&Win2500NGN PhoneCredit
Industry
[Nigeria Event]Discuss&win 2500 Naira Phone Credit
Forum category

Platform

Exhibition

Agent

Recruitment

EA

Industry

Market

Index
Gold/USD: Trading Strategy and Outlook
 Hong Kong | 2024-12-16 16:22
Recent Price Action
Gold broke below $2680 on Friday, dropping to $2648. The immediate support is expected around $2600.
Short-Term Outlook
In the near term, gold is likely to range between $2600-$2750. If $2600 holds as support, expect a period of fluctuation within this range.
From the daily chart, gold is currently hovering near the $2650 support level. A potential rebound could see prices testing $2680 and, if broken, $2700 would act as the next resistance level. Additional upside could revisit the recent high of $2725.
Bearish Scenario
If the daily chart closes below the 21-day moving average at $2640, gold may retest the December 6th low at $2613. The final support for buyers is at $2600.
Trading Strategy
Sell Entry: Consider selling at the upper boundary of the $2680–$2630 range.
Stop Loss: Set a strict stop loss at $10 below the entry point.
Target: Aim for the lower boundary of the range.
If $2640 holds, expect a potential rebound first, with further downside only if $2600 is broken.
Like 0
I want to comment, too
Submit
0Comments

There is no comment yet. Make the first one.

Submit
There is no comment yet. Make the first one.