2024-12-23 13:39
Industry1⃣Introduction to Candlesticks 🔥
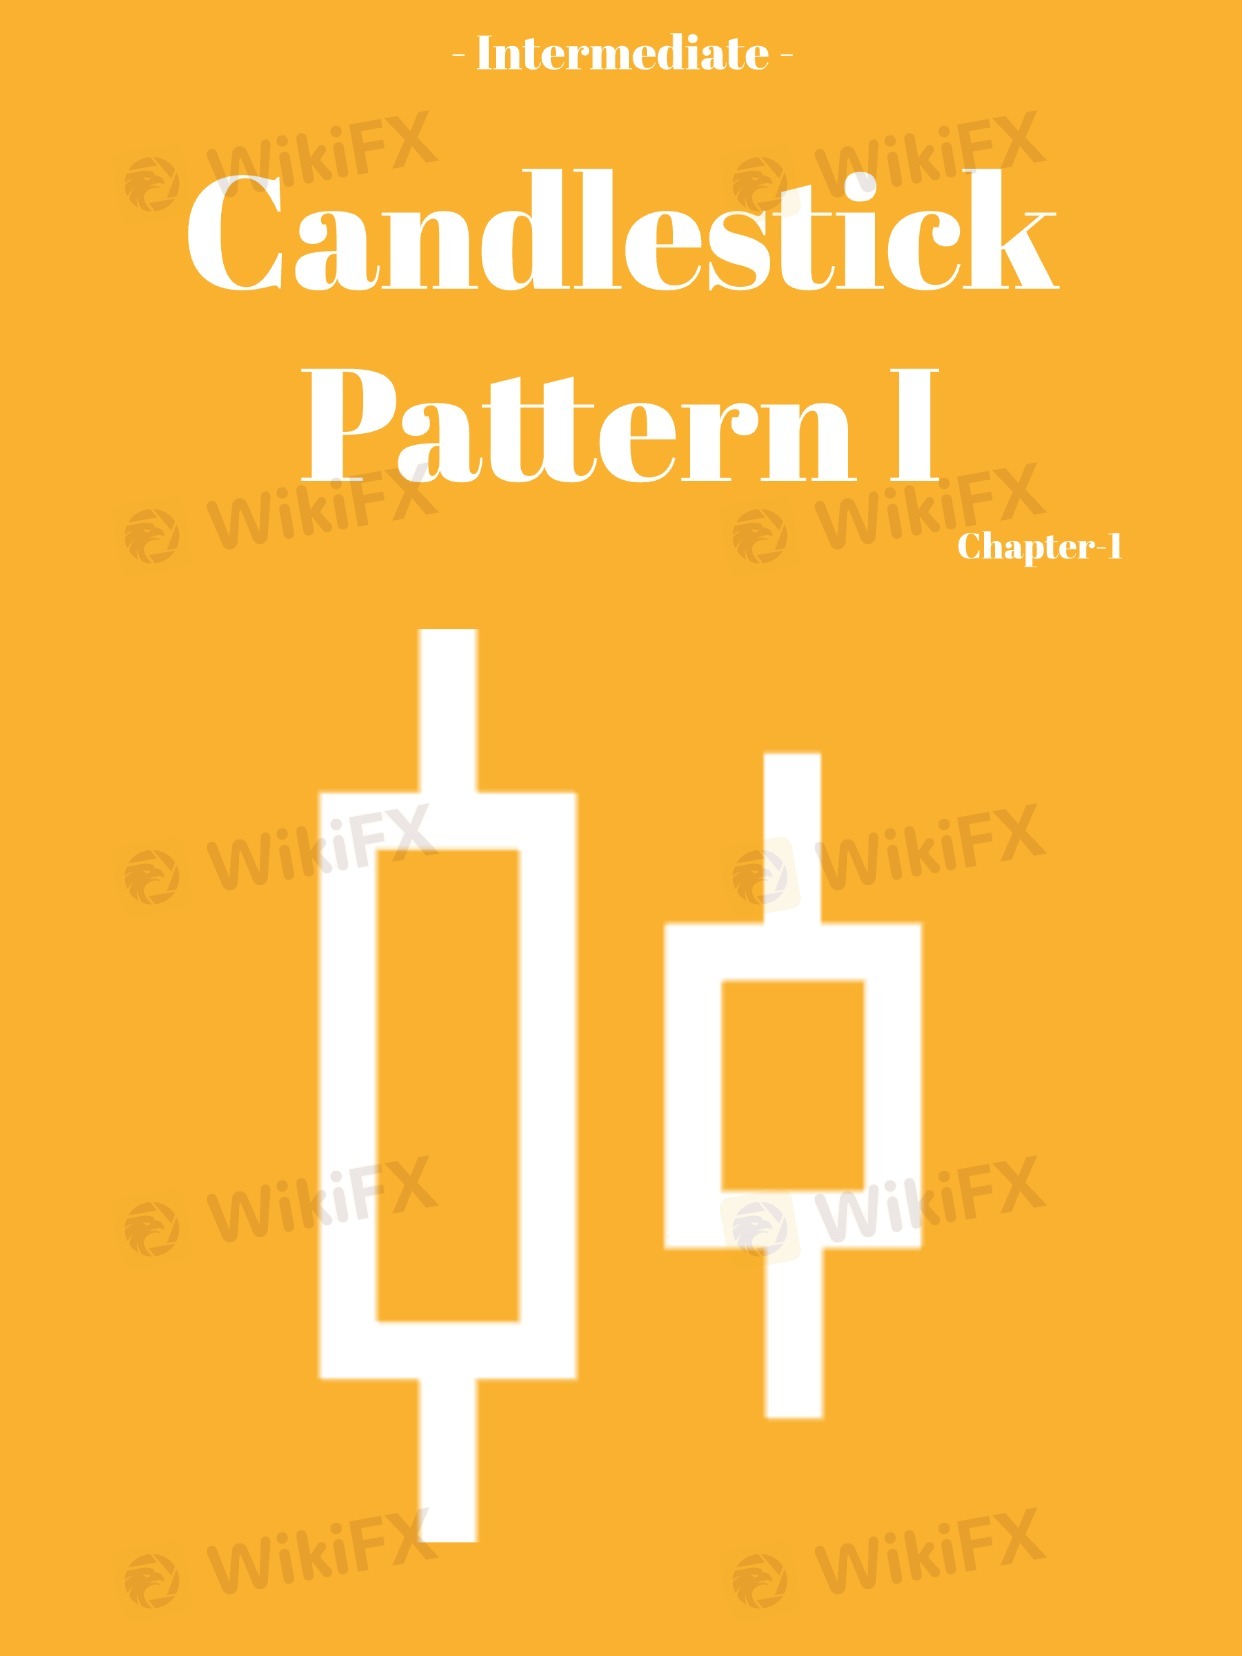
Candlesticks are a type of chart used in Forex trading to represent price movements over a specific time frame. Each candlestick gives us information about four key price points:
🔹Open: The price at the beginning of the time period.
🔹Close: The price at the end of the time period.
🔹High: The highest price during the time period.
🔹Low: The lowest price during the time period.
The candlestick body is the rectangular area between the open and close prices, and the wicks (or shadows) are the lines above and below the body, showing the highest and lowest prices during the time period.
Key Point: A green or white candlestick (bullish) means the price closed higher than it opened, showing buying pressure. A red or black candlestick (bearish) means the price closed lower than it opened, showing selling pressure. The longer the body, the stronger the trend. 📈
Like 0

Hot content
Industry
Event-A comment a day,Keep rewards worthy up to$27
Industry
Nigeria Event Giveaway-Win₦5000 Mobilephone Credit
Industry
Nigeria Event Giveaway-Win ₦2500 MobilePhoneCredit
Industry
South Africa Event-Come&Win 240ZAR Phone Credit
Industry
Nigeria Event-Discuss Forex&Win2500NGN PhoneCredit
Industry
[Nigeria Event]Discuss&win 2500 Naira Phone Credit
Forum category

Platform

Exhibition

Agent

Recruitment

EA

Industry

Market

Index
1⃣Introduction to Candlesticks 🔥
 Hong Kong | 2024-12-23 13:39
Candlesticks are a type of chart used in Forex trading to represent price movements over a specific time frame. Each candlestick gives us information about four key price points:
🔹Open: The price at the beginning of the time period.
🔹Close: The price at the end of the time period.
🔹High: The highest price during the time period.
🔹Low: The lowest price during the time period.
The candlestick body is the rectangular area between the open and close prices, and the wicks (or shadows) are the lines above and below the body, showing the highest and lowest prices during the time period.
Key Point: A green or white candlestick (bullish) means the price closed higher than it opened, showing buying pressure. A red or black candlestick (bearish) means the price closed lower than it opened, showing selling pressure. The longer the body, the stronger the trend. 📈
Like 0
I want to comment, too
Submit
0Comments

There is no comment yet. Make the first one.

Submit
There is no comment yet. Make the first one.