2025-01-14 18:28
IndustryUnderstanding Forex Charts: Candlesticks.
#firstdealoftgenewyearchewbacca#
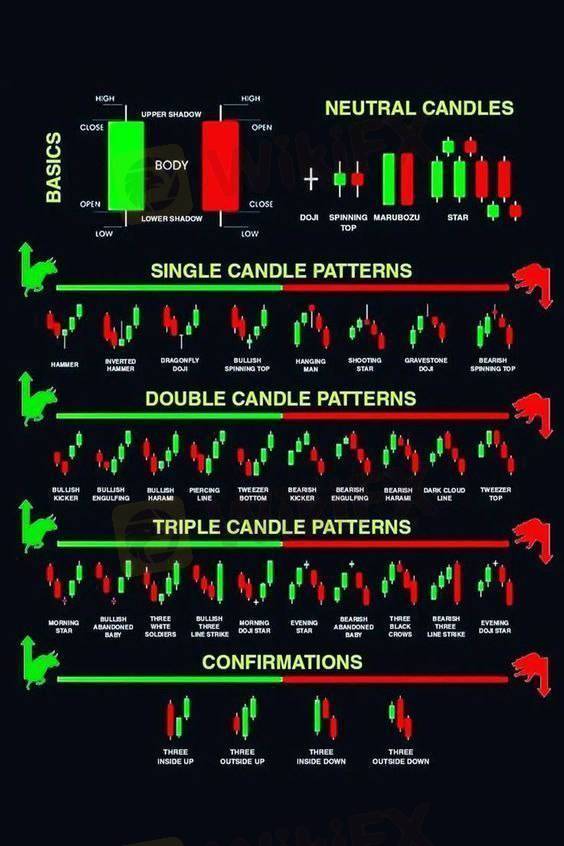
Candlestick charts are a popular way to visualize price movements in the foreign exchange (Forex) market. Each candlestick represents a specific time period and provides four key pieces of information:
1. **Open**: The price at the beginning of the time period.
2. **Close**: The price at the end of the time period.
3. **High**: The highest price reached during that time period.
4. **Low**: The lowest price reached during that time period.
### Components of a Candlestick:
- **Body**: The thick part of the candlestick that shows the range between the open and close prices. A green (or white) body indicates that the close was higher than the open, while a red (or black) body indicates that the close was lower than the open.
- **Wicks (or Shadows)**: The thin lines extending from the body represent the high and low prices of the period. The upper wick shows the high, while the lower wick shows the low.
### Patterns and Their Significance:
Candlestick patterns can provide insights into market sentiment and potential future movements. Some common patterns include:
- **Bullish Engulfing**: A larger green candle engulfs a smaller red candle, suggesting a potential upward trend.
- **Bearish Engulfing**: A larger red candle engulfs a smaller green candle, indicating a potential downward trend.
- **Doji**: A candlestick with a very small body, indicating indecision in the market.
### Time Frames:
Candlestick charts can be viewed in various time frames (1 minute, 5 minutes, hourly, daily, etc.), depending on the trader's strategy. Shorter time frames provide more granularity, while longer time frames can help identify broader trends.
### Conclusion:
Understanding candlestick patterns is essential for Forex trading, as they can help traders make informed decisions based on market behavior. Observing the color, size, and patterns of candlesticks can give insights into potential price movements.
Like 0
jefftiger
Trader
Hot content
Industry
Event-A comment a day,Keep rewards worthy up to$27
Industry
Nigeria Event Giveaway-Win₦5000 Mobilephone Credit
Industry
Nigeria Event Giveaway-Win ₦2500 MobilePhoneCredit
Industry
South Africa Event-Come&Win 240ZAR Phone Credit
Industry
Nigeria Event-Discuss Forex&Win2500NGN PhoneCredit
Industry
[Nigeria Event]Discuss&win 2500 Naira Phone Credit
Forum category

Platform

Exhibition

Agent

Recruitment

EA

Industry

Market

Index
Understanding Forex Charts: Candlesticks.
 Hong Kong | 2025-01-14 18:28
#firstdealoftgenewyearchewbacca#
Candlestick charts are a popular way to visualize price movements in the foreign exchange (Forex) market. Each candlestick represents a specific time period and provides four key pieces of information:
1. **Open**: The price at the beginning of the time period.
2. **Close**: The price at the end of the time period.
3. **High**: The highest price reached during that time period.
4. **Low**: The lowest price reached during that time period.
### Components of a Candlestick:
- **Body**: The thick part of the candlestick that shows the range between the open and close prices. A green (or white) body indicates that the close was higher than the open, while a red (or black) body indicates that the close was lower than the open.
- **Wicks (or Shadows)**: The thin lines extending from the body represent the high and low prices of the period. The upper wick shows the high, while the lower wick shows the low.
### Patterns and Their Significance:
Candlestick patterns can provide insights into market sentiment and potential future movements. Some common patterns include:
- **Bullish Engulfing**: A larger green candle engulfs a smaller red candle, suggesting a potential upward trend.
- **Bearish Engulfing**: A larger red candle engulfs a smaller green candle, indicating a potential downward trend.
- **Doji**: A candlestick with a very small body, indicating indecision in the market.
### Time Frames:
Candlestick charts can be viewed in various time frames (1 minute, 5 minutes, hourly, daily, etc.), depending on the trader's strategy. Shorter time frames provide more granularity, while longer time frames can help identify broader trends.
### Conclusion:
Understanding candlestick patterns is essential for Forex trading, as they can help traders make informed decisions based on market behavior. Observing the color, size, and patterns of candlesticks can give insights into potential price movements.
Like 0
I want to comment, too
Submit
0Comments

There is no comment yet. Make the first one.

Submit
There is no comment yet. Make the first one.