2025-01-28 17:23
IndustryHow to Spot a Fake Breakouts?
#firstdealofthenewyearAKEEL
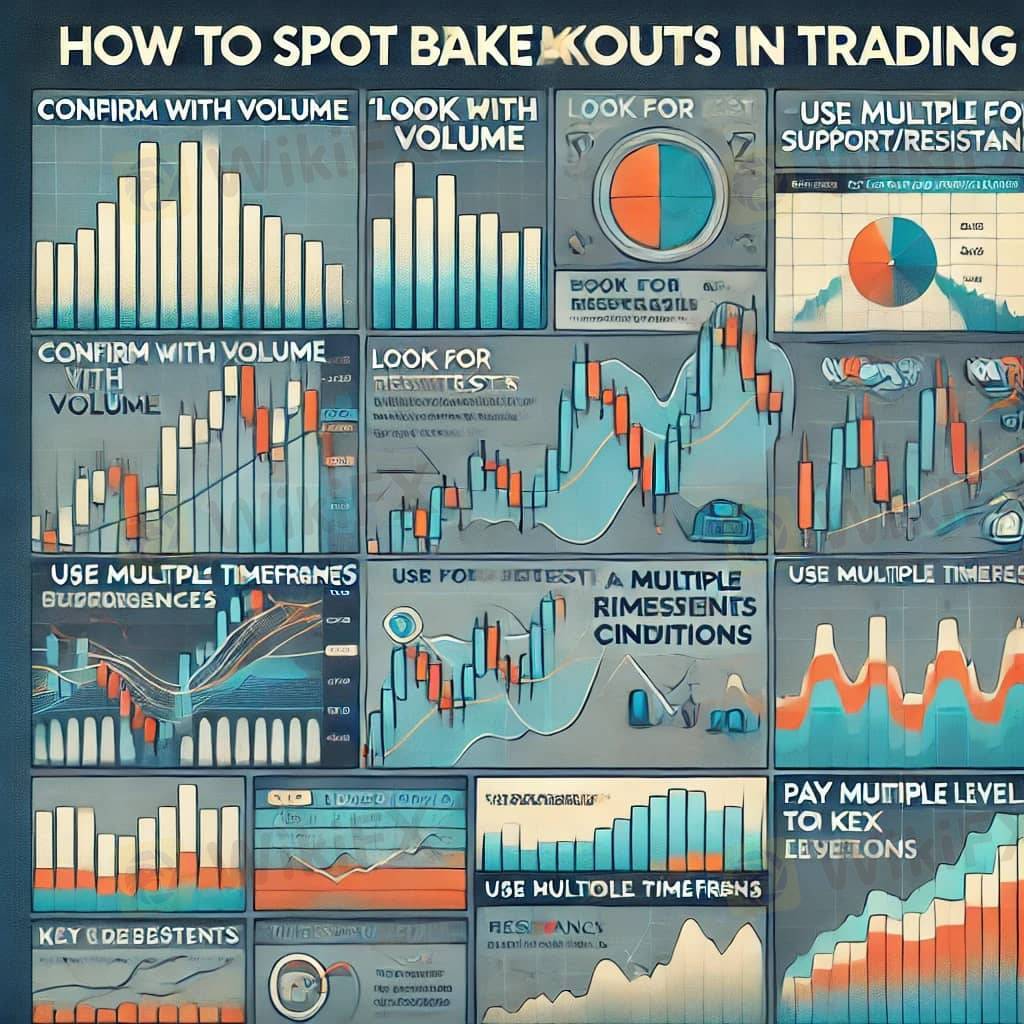
Spotting fake breakouts in trading is crucial to avoid losses and improve your decision-making. Here are some key strategies to identify fake breakouts:
1. Confirm with Volume
Real Breakout: Accompanied by high trading volume, showing strong interest from traders.
Fake Breakout: Happens on low or decreasing volume, signaling weak participation.
2. Look for Retests
Wait for the price to break a level (support/resistance) and retest it.
Real Breakout: The retest holds the new level (e.g., broken resistance becomes support).
Fake Breakout: The price quickly returns below or above the breakout level.
3. Use Multiple Timeframes
Analyze the breakout on both higher and lower timeframes.
Real Breakout: Appears consistent across multiple timeframes.
Fake Breakout: May look convincing on a smaller timeframe but weak or insignificant on a higher timeframe.
4. Watch for Divergences
Use indicators like the RSI or MACD to check for divergence.
Real Breakout: Aligns with the momentum indicated by these tools.
Fake Breakout: Shows a divergence where price moves up/down, but the indicator does not confirm.
5. Pay Attention to Key Levels
Identify strong historical levels of support or resistance.
Real Breakout: Occurs after multiple attempts to break a level.
Fake Breakout: Often breaks weak or newly formed levels with little market interest.
6. Analyze Market Conditions
Breakouts are less reliable during choppy or sideways markets.
Real Breakout: Likely in trending or volatile markets.
Fake Breakout: Common during low volatility or range-bound conditions.
7. Use Stop-Losses Strategically
Place stop-losses slightly beyond the breakout level to avoid getting caught by fake moves.
Pro Tip: Use ATR (Average True Range) to determine a safe stop distance.
8. News and Events
Check for upcoming economic events or news releases.
Real Breakout: Driven by significant news or data.
Fake Breakout: Can occur due to temporary volatility from minor events.
9. Candlestick Patterns
Study candlestick behavior at the breakout level.
Real Breakout: Includes strong continuation candles (e.g., bullish/bearish engulfing).
Fake Breakout: Shows reversal patterns like pin bars or dojis.
10. Wait for Confirmation
Avoid acting immediately after the breakout.
Real Breakout: Sustains the move beyond the breakout level.
Fake Breakout: Retraces back into the range quickly.
By combining these techniques, you can reduce the risk of falling for fake breakouts and make more informed trading decisions.
#firstdealofthenewyearAKEEL
Like 0

Badawi001
Broker
Hot content
Industry
Event-A comment a day,Keep rewards worthy up to$27
Industry
Nigeria Event Giveaway-Win₦5000 Mobilephone Credit
Industry
Nigeria Event Giveaway-Win ₦2500 MobilePhoneCredit
Industry
South Africa Event-Come&Win 240ZAR Phone Credit
Industry
Nigeria Event-Discuss Forex&Win2500NGN PhoneCredit
Industry
[Nigeria Event]Discuss&win 2500 Naira Phone Credit
Forum category

Platform

Exhibition

Agent

Recruitment

EA

Industry

Market

Index
How to Spot a Fake Breakouts?
 Hong Kong | 2025-01-28 17:23
#firstdealofthenewyearAKEEL
Spotting fake breakouts in trading is crucial to avoid losses and improve your decision-making. Here are some key strategies to identify fake breakouts:
1. Confirm with Volume
Real Breakout: Accompanied by high trading volume, showing strong interest from traders.
Fake Breakout: Happens on low or decreasing volume, signaling weak participation.
2. Look for Retests
Wait for the price to break a level (support/resistance) and retest it.
Real Breakout: The retest holds the new level (e.g., broken resistance becomes support).
Fake Breakout: The price quickly returns below or above the breakout level.
3. Use Multiple Timeframes
Analyze the breakout on both higher and lower timeframes.
Real Breakout: Appears consistent across multiple timeframes.
Fake Breakout: May look convincing on a smaller timeframe but weak or insignificant on a higher timeframe.
4. Watch for Divergences
Use indicators like the RSI or MACD to check for divergence.
Real Breakout: Aligns with the momentum indicated by these tools.
Fake Breakout: Shows a divergence where price moves up/down, but the indicator does not confirm.
5. Pay Attention to Key Levels
Identify strong historical levels of support or resistance.
Real Breakout: Occurs after multiple attempts to break a level.
Fake Breakout: Often breaks weak or newly formed levels with little market interest.
6. Analyze Market Conditions
Breakouts are less reliable during choppy or sideways markets.
Real Breakout: Likely in trending or volatile markets.
Fake Breakout: Common during low volatility or range-bound conditions.
7. Use Stop-Losses Strategically
Place stop-losses slightly beyond the breakout level to avoid getting caught by fake moves.
Pro Tip: Use ATR (Average True Range) to determine a safe stop distance.
8. News and Events
Check for upcoming economic events or news releases.
Real Breakout: Driven by significant news or data.
Fake Breakout: Can occur due to temporary volatility from minor events.
9. Candlestick Patterns
Study candlestick behavior at the breakout level.
Real Breakout: Includes strong continuation candles (e.g., bullish/bearish engulfing).
Fake Breakout: Shows reversal patterns like pin bars or dojis.
10. Wait for Confirmation
Avoid acting immediately after the breakout.
Real Breakout: Sustains the move beyond the breakout level.
Fake Breakout: Retraces back into the range quickly.
By combining these techniques, you can reduce the risk of falling for fake breakouts and make more informed trading decisions.
#firstdealofthenewyearAKEEL
Like 0
I want to comment, too
Submit
0Comments

There is no comment yet. Make the first one.

Submit
There is no comment yet. Make the first one.