
2025-01-30 18:38
IndustryWhat Are Candlestick Patterns in Crypto Trading?
#firstdealofthenewyearFateema
Candlestick patterns in crypto trading are visual representations of price movements within a specific time frame. Each candlestick shows four key price points:
Open – The price at which the asset started trading during the time frame.
Close – The price at which the asset ended trading during the time frame.
High – The highest price reached during the time frame.
Low – The lowest price reached during the time frame.
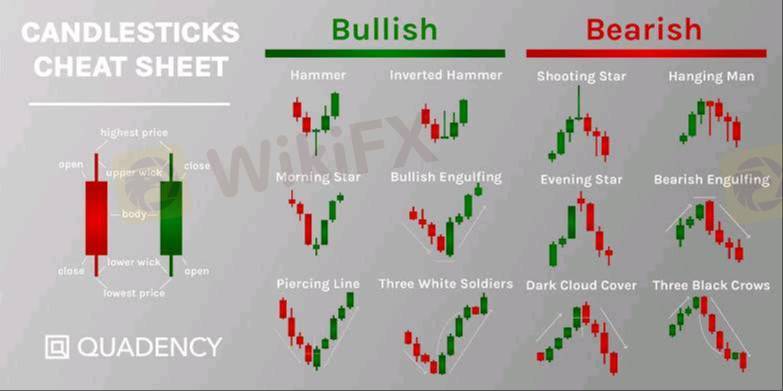
Structure of a Candlestick:
Body: The colored or filled part of the candlestick, showing the difference between the opening and closing prices.
Wicks (Shadows): Thin lines extending from the top and bottom, indicating the high and low prices.
Common Candlestick Patterns:
Bullish Patterns (Indicating a Potential Uptrend)
1. Bullish Engulfing – A large green candle completely engulfs the previous red candle, signaling strong buying pressure.
2. Hammer – A small body with a long lower wick, showing rejection of lower prices and a possible reversal upward.
3. Morning Star – A three-candle pattern signaling the end of a downtrend and the start of an uptrend.
Bearish Patterns (Indicating a Potential Downtrend)
1. Bearish Engulfing – A large red candle engulfs the previous green candle, signaling strong selling pressure.
2. Shooting Star – A small body with a long upper wick, showing rejection of higher prices and a possible downward reversal.
3. Evening Star – A three-candle pattern signaling the end of an uptrend and the start of a downtrend.
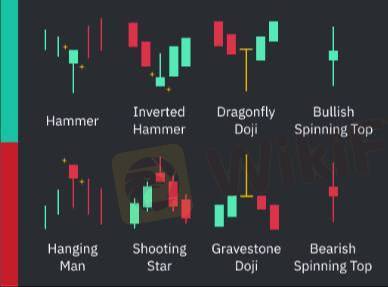
Neutral/Continuation Patterns
1. Doji – A candle where the open and close are nearly the same, signaling market indecision.
2. Spinning Top – A small-bodied candle with long wicks, indicating uncertainty.
3. Inside Bar – A smaller candle forming within the range of the previous larger candle, often leading to a breakout.
How Traders Use Candlestick Patterns
Traders analyze candlestick patterns alongside technical indicators (e.g., RSI, moving averages, volume) to predict potential price movements. While no pattern guarantees accuracy, they help traders make informed decisions on entries, exits, and risk management.
Would you like a detailed breakdown of a specific pattern?
Like 0

uwakmfon48
Trader
Hot content
Industry
Event-A comment a day,Keep rewards worthy up to$27
Industry
Nigeria Event Giveaway-Win₦5000 Mobilephone Credit
Industry
Nigeria Event Giveaway-Win ₦2500 MobilePhoneCredit
Industry
South Africa Event-Come&Win 240ZAR Phone Credit
Industry
Nigeria Event-Discuss Forex&Win2500NGN PhoneCredit
Industry
[Nigeria Event]Discuss&win 2500 Naira Phone Credit
Forum category

Platform

Exhibition

Agent

Recruitment

EA

Industry

Market

Index
What Are Candlestick Patterns in Crypto Trading?
Nigeria | 2025-01-30 18:38#firstdealofthenewyearFateema
Candlestick patterns in crypto trading are visual representations of price movements within a specific time frame. Each candlestick shows four key price points:
Open – The price at which the asset started trading during the time frame.
Close – The price at which the asset ended trading during the time frame.
High – The highest price reached during the time frame.
Low – The lowest price reached during the time frame.
Structure of a Candlestick:
Body: The colored or filled part of the candlestick, showing the difference between the opening and closing prices.
Wicks (Shadows): Thin lines extending from the top and bottom, indicating the high and low prices.
Common Candlestick Patterns:
Bullish Patterns (Indicating a Potential Uptrend)
1. Bullish Engulfing – A large green candle completely engulfs the previous red candle, signaling strong buying pressure.
2. Hammer – A small body with a long lower wick, showing rejection of lower prices and a possible reversal upward.
3. Morning Star – A three-candle pattern signaling the end of a downtrend and the start of an uptrend.
Bearish Patterns (Indicating a Potential Downtrend)
1. Bearish Engulfing – A large red candle engulfs the previous green candle, signaling strong selling pressure.
2. Shooting Star – A small body with a long upper wick, showing rejection of higher prices and a possible downward reversal.
3. Evening Star – A three-candle pattern signaling the end of an uptrend and the start of a downtrend.
Neutral/Continuation Patterns
1. Doji – A candle where the open and close are nearly the same, signaling market indecision.
2. Spinning Top – A small-bodied candle with long wicks, indicating uncertainty.
3. Inside Bar – A smaller candle forming within the range of the previous larger candle, often leading to a breakout.
How Traders Use Candlestick Patterns
Traders analyze candlestick patterns alongside technical indicators (e.g., RSI, moving averages, volume) to predict potential price movements. While no pattern guarantees accuracy, they help traders make informed decisions on entries, exits, and risk management.
Would you like a detailed breakdown of a specific pattern?
Like 0
I want to comment, too
Submit
0Comments

There is no comment yet. Make the first one.
Submit
There is no comment yet. Make the first one.