
2025-01-31 16:19
IndustryTrendlines and Their Importance in Trading
#firstdealofthenewyearFateema
Trendlines and Their Importance in Trading
What Are Trendlines?
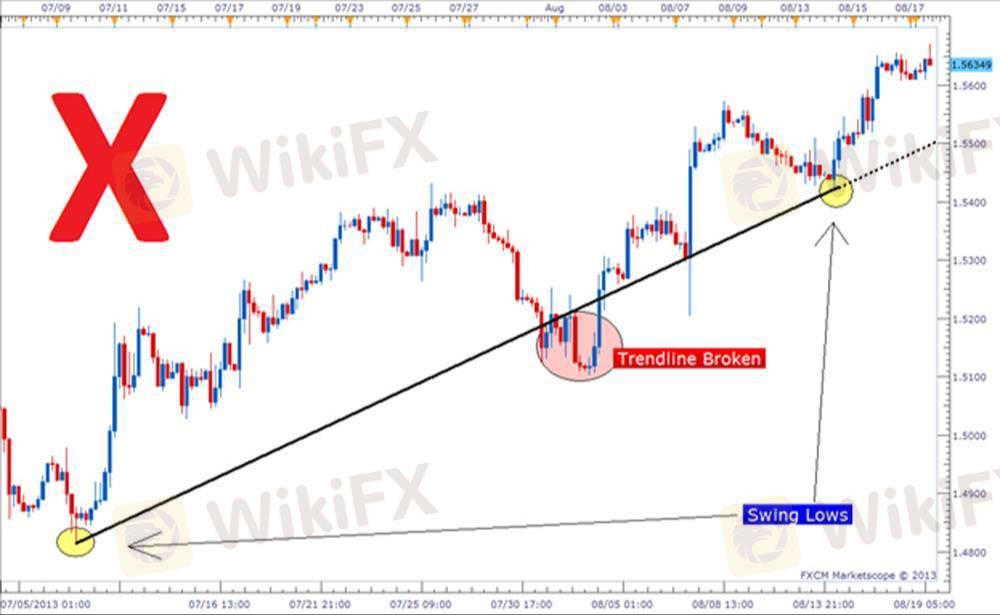
A trendline is a straight line drawn on a price chart to connect significant price points, helping traders visualize the direction of an asset’s trend. Trendlines are essential in technical analysis as they serve as dynamic support and resistance levels.
Types of Trendlines
1. Uptrend Line (Bullish Trendline):
Drawn by connecting higher lows.
Indicates a rising market with strong buying pressure.
2. Downtrend Line (Bearish Trendline):
Drawn by connecting lower highs.
Shows a declining market with dominant selling pressure.
3. Sideways Trendline (Range-bound Market):
Drawn when prices move horizontally.
Signals consolidation before a breakout or breakdown.
Importance of Trendlines in Trading
1. Identifying Market Trends: Helps traders recognize bullish, bearish, or sideways movements.
2. Support & Resistance Levels: Acts as psychological barriers where price reactions often occur.
3. Entry & Exit Points: Traders use trendlines to determine the best positions for buying and selling.
4. Confirming Breakouts: A break above a downtrend line or below an uptrend line signals potential trend reversals.
5. Improving Risk Management: Stops and limits can be placed around trendlines to minimize losses.
How to Draw an Effective Trendline
Use at least two significant price points.
The more times the price touches the trendline, the stronger it is.
Avoid forcing a line to fit data—keep it natural.
Adjust trendlines over time as new price action develops.
Would you like me to include practical trading strategies using trendlines?
Like 0

asuquopeace
Trader
Hot content
Industry
Event-A comment a day,Keep rewards worthy up to$27
Industry
Nigeria Event Giveaway-Win₦5000 Mobilephone Credit
Industry
Nigeria Event Giveaway-Win ₦2500 MobilePhoneCredit
Industry
South Africa Event-Come&Win 240ZAR Phone Credit
Industry
Nigeria Event-Discuss Forex&Win2500NGN PhoneCredit
Industry
[Nigeria Event]Discuss&win 2500 Naira Phone Credit
Forum category

Platform

Exhibition

Agent

Recruitment

EA

Industry

Market

Index
Trendlines and Their Importance in Trading
Nigeria | 2025-01-31 16:19#firstdealofthenewyearFateema
Trendlines and Their Importance in Trading
What Are Trendlines?
A trendline is a straight line drawn on a price chart to connect significant price points, helping traders visualize the direction of an asset’s trend. Trendlines are essential in technical analysis as they serve as dynamic support and resistance levels.
Types of Trendlines
1. Uptrend Line (Bullish Trendline):
Drawn by connecting higher lows.
Indicates a rising market with strong buying pressure.
2. Downtrend Line (Bearish Trendline):
Drawn by connecting lower highs.
Shows a declining market with dominant selling pressure.
3. Sideways Trendline (Range-bound Market):
Drawn when prices move horizontally.
Signals consolidation before a breakout or breakdown.
Importance of Trendlines in Trading
1. Identifying Market Trends: Helps traders recognize bullish, bearish, or sideways movements.
2. Support & Resistance Levels: Acts as psychological barriers where price reactions often occur.
3. Entry & Exit Points: Traders use trendlines to determine the best positions for buying and selling.
4. Confirming Breakouts: A break above a downtrend line or below an uptrend line signals potential trend reversals.
5. Improving Risk Management: Stops and limits can be placed around trendlines to minimize losses.
How to Draw an Effective Trendline
Use at least two significant price points.
The more times the price touches the trendline, the stronger it is.
Avoid forcing a line to fit data—keep it natural.
Adjust trendlines over time as new price action develops.
Would you like me to include practical trading strategies using trendlines?
Like 0
I want to comment, too
Submit
0Comments

There is no comment yet. Make the first one.
Submit
There is no comment yet. Make the first one.