
2025-02-05 19:45
IndustryHow to trade using candlestick formations
#firstdealofthenewyearchewbacca#
Trading using candlestick formations involves analyzing patterns in candlestick charts to predict potential market movements. Here’s a step-by-step guide to help you get started:
1. Understand Candlestick Basics
Each candlestick represents price movement within a specific time frame (e.g., 1 minute, 1 hour, 1 day). It shows four key pieces of information:
Open: The price at the start of the time frame.
Close: The price at the end of the time frame.
High: The highest price reached during the time frame.
Low: The lowest price reached during the time frame.
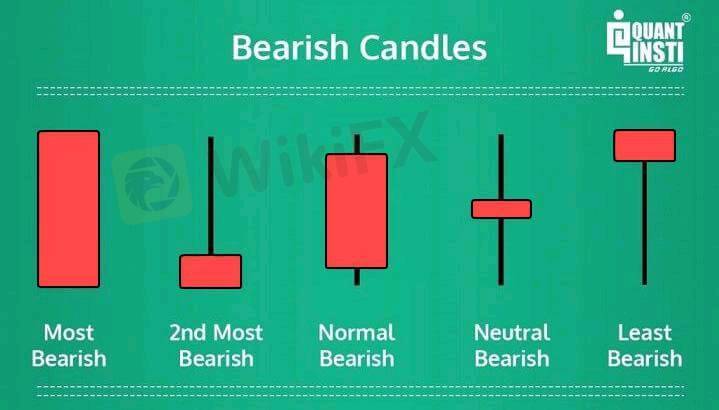
A bullish candle (price goes up) is usually green or white, while a bearish candle (price goes down) is typically red or black.
---
2. Learn Common Candlestick Patterns
Candlestick patterns can indicate reversals or continuations in price trends.
Reversal Patterns
Bullish Engulfing: A small red candle followed by a larger green candle that fully engulfs the previous one, suggesting a potential upward reversal.
Bearish Engulfing: A small green candle followed by a larger red candle, indicating a potential downward reversal.
Hammer: A small body with a long lower wick, often seen at the bottom of a downtrend, signaling a possible reversal up.
Shooting Star: A small body with a long upper wick, often found at the top of an uptrend, signaling a potential reversal down.
Continuation Patterns
Doji: The open and close prices are nearly equal, indicating market indecision. Its significance depends on the preceding trend.
Three White Soldiers: Three consecutive long green candles, suggesting strong bullish momentum.
Three Black Crows: Three consecutive long red candles, signaling strong bearish momentum.
---
3. Combine Candlestick Patterns with Other Tools
Candlestick formations are more effective when combined with other technical analysis tools:
Support and Resistance Levels: Identify key price levels where price tends to reverse or stall.
Trend Lines and Moving Averages: Confirm whether the market is trending or ranging.
Volume Analysis: High volume can validate candlestick patterns.
---
4. Set Up a Trading Plan
Entry Point: Enter the trade when a candlestick pattern forms near a key level (support, resistance, or trendline).
Stop-Loss: Place stop-loss orders below/above the candlestick pattern to manage risk.
Take Profit: Set realistic profit targets based on previous price action or risk-reward ratios.
---
5. Example Strategy
Bullish Engulfing Pattern at Support:
1. Identify a support level.
2. Look for a bullish engulfing pattern near that support.
3. Enter a buy position after the pattern is confirmed.
4. Set a stop-loss just below the support level.
5. Set a take-profit target based on the nearest resistance.
---
6. Practice and Refine
Start by practicing on demo accounts to get familiar with different candlestick patterns and how they work in various market conditions. Keep a trading journal to track your trades and improve your strategy over time.
Like 0

bossbaby6527
Trader
Hot content
Industry
Event-A comment a day,Keep rewards worthy up to$27
Industry
Nigeria Event Giveaway-Win₦5000 Mobilephone Credit
Industry
Nigeria Event Giveaway-Win ₦2500 MobilePhoneCredit
Industry
South Africa Event-Come&Win 240ZAR Phone Credit
Industry
Nigeria Event-Discuss Forex&Win2500NGN PhoneCredit
Industry
[Nigeria Event]Discuss&win 2500 Naira Phone Credit
Forum category

Platform

Exhibition

Agent

Recruitment

EA

Industry

Market

Index
How to trade using candlestick formations
Nigeria | 2025-02-05 19:45#firstdealofthenewyearchewbacca#
Trading using candlestick formations involves analyzing patterns in candlestick charts to predict potential market movements. Here’s a step-by-step guide to help you get started:
1. Understand Candlestick Basics
Each candlestick represents price movement within a specific time frame (e.g., 1 minute, 1 hour, 1 day). It shows four key pieces of information:
Open: The price at the start of the time frame.
Close: The price at the end of the time frame.
High: The highest price reached during the time frame.
Low: The lowest price reached during the time frame.
A bullish candle (price goes up) is usually green or white, while a bearish candle (price goes down) is typically red or black.
---
2. Learn Common Candlestick Patterns
Candlestick patterns can indicate reversals or continuations in price trends.
Reversal Patterns
Bullish Engulfing: A small red candle followed by a larger green candle that fully engulfs the previous one, suggesting a potential upward reversal.
Bearish Engulfing: A small green candle followed by a larger red candle, indicating a potential downward reversal.
Hammer: A small body with a long lower wick, often seen at the bottom of a downtrend, signaling a possible reversal up.
Shooting Star: A small body with a long upper wick, often found at the top of an uptrend, signaling a potential reversal down.
Continuation Patterns
Doji: The open and close prices are nearly equal, indicating market indecision. Its significance depends on the preceding trend.
Three White Soldiers: Three consecutive long green candles, suggesting strong bullish momentum.
Three Black Crows: Three consecutive long red candles, signaling strong bearish momentum.
---
3. Combine Candlestick Patterns with Other Tools
Candlestick formations are more effective when combined with other technical analysis tools:
Support and Resistance Levels: Identify key price levels where price tends to reverse or stall.
Trend Lines and Moving Averages: Confirm whether the market is trending or ranging.
Volume Analysis: High volume can validate candlestick patterns.
---
4. Set Up a Trading Plan
Entry Point: Enter the trade when a candlestick pattern forms near a key level (support, resistance, or trendline).
Stop-Loss: Place stop-loss orders below/above the candlestick pattern to manage risk.
Take Profit: Set realistic profit targets based on previous price action or risk-reward ratios.
---
5. Example Strategy
Bullish Engulfing Pattern at Support:
1. Identify a support level.
2. Look for a bullish engulfing pattern near that support.
3. Enter a buy position after the pattern is confirmed.
4. Set a stop-loss just below the support level.
5. Set a take-profit target based on the nearest resistance.
---
6. Practice and Refine
Start by practicing on demo accounts to get familiar with different candlestick patterns and how they work in various market conditions. Keep a trading journal to track your trades and improve your strategy over time.
Like 0
I want to comment, too
Submit
0Comments

There is no comment yet. Make the first one.
Submit
There is no comment yet. Make the first one.