2025-02-15 01:45
IndustryTECHNICAL ANALYSIS TECHNIQUES FOR POTENTIAL LOSS
#firstdealofthenewyearastylz
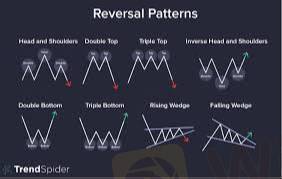
In technical analysis, identifying potential losses is just as important as spotting opportunities for gains. Here are some key techniques to help detect and manage potential losses in trading:
1. Stop-Loss Orders
A predetermined price level where you exit a trade to limit losses.
Can be fixed (e.g., 5% below entry price) or trailing (moves with price action).
2. Support & Resistance Levels
Breaking support (a key level where price previously bounced) may indicate further downside.
If a stock fails to break resistance multiple times, it may signal weakness and a potential downturn.
3. Trend Analysis
Moving Averages: A drop below the 200-day moving average can signal a long-term downtrend.
Trendlines: A break below an upward trendline may indicate a reversal and potential loss.
4. Candlestick Patterns
Bearish engulfing, shooting star, or hanging man patterns suggest potential downside.
Doji followed by a strong red candle indicates uncertainty turning into selling pressure.
5. Volume Analysis
High volume on down days signals strong selling pressure, which may indicate further losses.
Divergences between price and volume (e.g., price rising but volume decreasing) can signal weakness.
6. Relative Strength Index (RSI)
Overbought (>70) may indicate a reversal or correction.
Bearish divergence (price makes a new high, but RSI doesn’t) suggests weakening momentum.
7. Moving Average Convergence Divergence (MACD)
A bearish crossover (MACD line crossing below the signal line) signals downside risk.
A divergence (price rising but MACD falling) warns of trend weakness.
8. Bollinger Bands
Price touching the upper band and reversing may indicate a pullback.
Break below the lower band with high volume suggests strong selling pressure.
9. Fibonacci Retracements
If price fails to hold key retracement levels (e.g., 61.8%), further downside is likely.
10. Market Sentiment Indicators
Fear & Greed Index: Extreme greed can indicate a coming correction.
Put/Call Ratio: A high ratio suggests bearish sentiment.
Risk Management Tips
Always set a risk-reward ratio (e.g., 1:3) to cut losses quickly.
Diversify your portfolio to reduce risk.
Avoid revenge trading after a loss.
Like 0

Babatunde5040
Broker
Hot content
Industry
Event-A comment a day,Keep rewards worthy up to$27
Industry
Nigeria Event Giveaway-Win₦5000 Mobilephone Credit
Industry
Nigeria Event Giveaway-Win ₦2500 MobilePhoneCredit
Industry
South Africa Event-Come&Win 240ZAR Phone Credit
Industry
Nigeria Event-Discuss Forex&Win2500NGN PhoneCredit
Industry
[Nigeria Event]Discuss&win 2500 Naira Phone Credit
Forum category

Platform

Exhibition

Agent

Recruitment

EA

Industry

Market

Index
TECHNICAL ANALYSIS TECHNIQUES FOR POTENTIAL LOSS
 Hong Kong | 2025-02-15 01:45
#firstdealofthenewyearastylz
In technical analysis, identifying potential losses is just as important as spotting opportunities for gains. Here are some key techniques to help detect and manage potential losses in trading:
1. Stop-Loss Orders
A predetermined price level where you exit a trade to limit losses.
Can be fixed (e.g., 5% below entry price) or trailing (moves with price action).
2. Support & Resistance Levels
Breaking support (a key level where price previously bounced) may indicate further downside.
If a stock fails to break resistance multiple times, it may signal weakness and a potential downturn.
3. Trend Analysis
Moving Averages: A drop below the 200-day moving average can signal a long-term downtrend.
Trendlines: A break below an upward trendline may indicate a reversal and potential loss.
4. Candlestick Patterns
Bearish engulfing, shooting star, or hanging man patterns suggest potential downside.
Doji followed by a strong red candle indicates uncertainty turning into selling pressure.
5. Volume Analysis
High volume on down days signals strong selling pressure, which may indicate further losses.
Divergences between price and volume (e.g., price rising but volume decreasing) can signal weakness.
6. Relative Strength Index (RSI)
Overbought (>70) may indicate a reversal or correction.
Bearish divergence (price makes a new high, but RSI doesn’t) suggests weakening momentum.
7. Moving Average Convergence Divergence (MACD)
A bearish crossover (MACD line crossing below the signal line) signals downside risk.
A divergence (price rising but MACD falling) warns of trend weakness.
8. Bollinger Bands
Price touching the upper band and reversing may indicate a pullback.
Break below the lower band with high volume suggests strong selling pressure.
9. Fibonacci Retracements
If price fails to hold key retracement levels (e.g., 61.8%), further downside is likely.
10. Market Sentiment Indicators
Fear & Greed Index: Extreme greed can indicate a coming correction.
Put/Call Ratio: A high ratio suggests bearish sentiment.
Risk Management Tips
Always set a risk-reward ratio (e.g., 1:3) to cut losses quickly.
Diversify your portfolio to reduce risk.
Avoid revenge trading after a loss.
Like 0
I want to comment, too
Submit
0Comments

There is no comment yet. Make the first one.

Submit
There is no comment yet. Make the first one.