
2025-03-04 22:31
Industry#AITradingAffectsForex
AI and Forex Overbought/Oversold Signals
Overbought and oversold conditions in the Forex market refer to situations where a currency pair’s price is perceived as being too high (overbought) or too low (oversold) relative to its historical behavior. These conditions can indicate potential price reversals, and AI models are increasingly used to predict when such signals might lead to profitable trades.
1. Understanding Overbought/Oversold Signals in Forex
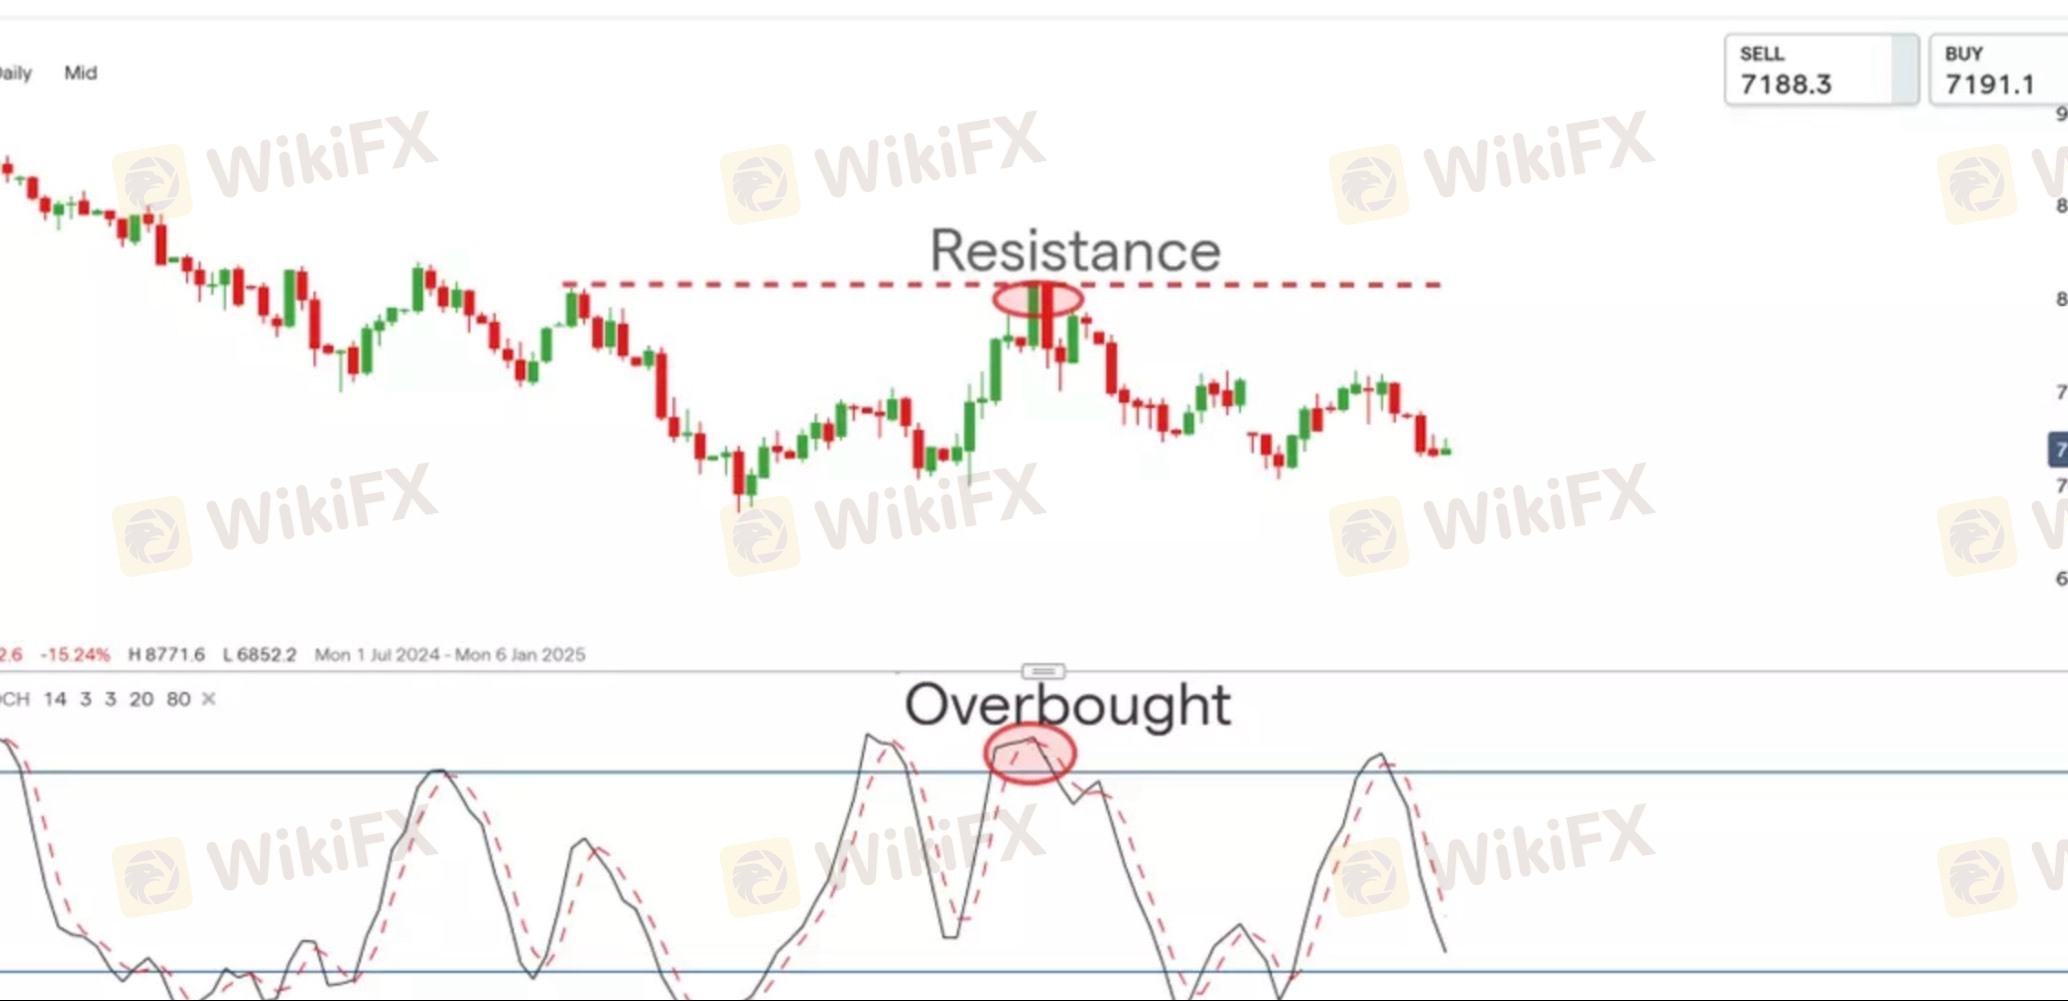
• Overbought Conditions: Occur when a currency’s price has risen too quickly or too far, suggesting that the currency might be overvalued and due for a pullback or price correction.
• Oversold Conditions: Happen when the price has fallen too far or too quickly, signaling that the currency might be undervalued and could be due for a rebound.
These signals are often used in conjunction with technical indicators like RSI (Relative Strength Index), Stochastic Oscillator, and CCI (Commodity Channel Index) to help identify when the market is in overbought or oversold conditions.
2. AI Techniques for Identifying Overbought/Oversold Conditions
AI models can improve the accuracy and speed of detecting overbought or oversold conditions by analyzing large datasets and finding complex relationships that traditional indicators might miss.
Machine Learning Models
• Random Forest & XGBoost: These models are used to detect patterns in historical price and technical indicator data. They can be trained to recognize the conditions under which a currency is overbought or oversold by identifying critical features like moving averages, RSI, and candlestick patterns.
• Support Vector Machines (SVM): SVMs can classify price movements into “overbought,” “oversold,” or “neutral” categories based on past market behavior and key features such as momentum indicators or volatility measures.
• K-Means Clustering: K-Means can be used to cluster historical price data into different groups based on market conditions. Clusters can represent overbought, oversold, or neutral market states, helping to predict the likelihood of reversal.
Deep Learning Models
• Long Short-Term Memory (LSTM): LSTMs are ideal for time-series forecasting, allowing them to learn sequential dependencies in Forex price data. LSTM networks can be trained to detect overbought and oversold conditions over multiple timeframes (e.g., 1-hour, daily, or weekly charts), recognizing patterns that lead to reversals.
• Convolutional Neural Networks (CNNs): CNNs can be applied to analyze Forex charts, detecting patterns (such as support and resistance levels) that might suggest an overbought or oversold condition is likely to trigger a reversal.
• Autoencoders: Used for anomaly detection, autoencoders can identify unusual price movements or deviations from historical price trends that indicate overbought or oversold conditions.
3. Key Indicators for Overbought/Oversold Detection
While AI models use a variety of data, the following technical indicators are commonly used in conjunction with AI models to identify overbought and oversold conditions:
• RSI (Relative Strength Index): The RSI is a momentum oscillator that moves between 0 and 100. Readings above 70 are considered overbought, and readings below 30 are considered oversold. AI can detect when the RSI is approaching these critical levels and predict potential price reversals.
• Stochastic Oscillator: Similar to RSI, this oscillator compares a currency’s closing price to its price range over a specific period. Overbought conditions are indicated when the value exceeds 80, and oversold conditions occur when it is below 20.
• CCI (Commodity Channel Index): This indicator helps to identify cyclical trends in a market. Readings above +100 suggest an overbought market, while readings below -100 signal an oversold market.
• Bollinger Bands: Price touching or exceeding the upper band often suggests overbought conditions, while touching or falling below the lower band suggests oversold conditions.
• Moving Average Convergence Divergence (MACD): MACD can help identify potential reversals. When the MACD crosses below its signal line, it can indicate an oversold condition, and when it crosses above, it may suggest an overbought condition.
4. Data Sources for AI-Based Overbought/Oversold Prediction
AI models analyze various data sources to detect overbought and oversold conditions:
• Price Data: Historical price movements, including OHLC (Open, High, Low, Close), help detect price extremes that suggest overbought or oversold conditions.
• Technical Indicators: RSI, Stochastic, CCI, MACD, Bollinger Bands, and other momentum indicators.
• Volume Data: Volume spikes can confirm or invalidate overbought or oversold signals. AI models use volume data in conjunction with price data to provide more accurate predictions.
• Sentiment Analysis: Sentiment derived from financial news, social media, and macroeconomic reports can indicate market optimism (leading to overbough
Like 0

FX4183914356
Trader
Hot content
Industry
Event-A comment a day,Keep rewards worthy up to$27
Industry
Nigeria Event Giveaway-Win₦5000 Mobilephone Credit
Industry
Nigeria Event Giveaway-Win ₦2500 MobilePhoneCredit
Industry
South Africa Event-Come&Win 240ZAR Phone Credit
Industry
Nigeria Event-Discuss Forex&Win2500NGN PhoneCredit
Industry
[Nigeria Event]Discuss&win 2500 Naira Phone Credit
Forum category

Platform

Exhibition

Agent

Recruitment

EA

Industry

Market

Index
#AITradingAffectsForex
India | 2025-03-04 22:31AI and Forex Overbought/Oversold Signals
Overbought and oversold conditions in the Forex market refer to situations where a currency pair’s price is perceived as being too high (overbought) or too low (oversold) relative to its historical behavior. These conditions can indicate potential price reversals, and AI models are increasingly used to predict when such signals might lead to profitable trades.
1. Understanding Overbought/Oversold Signals in Forex
• Overbought Conditions: Occur when a currency’s price has risen too quickly or too far, suggesting that the currency might be overvalued and due for a pullback or price correction.
• Oversold Conditions: Happen when the price has fallen too far or too quickly, signaling that the currency might be undervalued and could be due for a rebound.
These signals are often used in conjunction with technical indicators like RSI (Relative Strength Index), Stochastic Oscillator, and CCI (Commodity Channel Index) to help identify when the market is in overbought or oversold conditions.
2. AI Techniques for Identifying Overbought/Oversold Conditions
AI models can improve the accuracy and speed of detecting overbought or oversold conditions by analyzing large datasets and finding complex relationships that traditional indicators might miss.
Machine Learning Models
• Random Forest & XGBoost: These models are used to detect patterns in historical price and technical indicator data. They can be trained to recognize the conditions under which a currency is overbought or oversold by identifying critical features like moving averages, RSI, and candlestick patterns.
• Support Vector Machines (SVM): SVMs can classify price movements into “overbought,” “oversold,” or “neutral” categories based on past market behavior and key features such as momentum indicators or volatility measures.
• K-Means Clustering: K-Means can be used to cluster historical price data into different groups based on market conditions. Clusters can represent overbought, oversold, or neutral market states, helping to predict the likelihood of reversal.
Deep Learning Models
• Long Short-Term Memory (LSTM): LSTMs are ideal for time-series forecasting, allowing them to learn sequential dependencies in Forex price data. LSTM networks can be trained to detect overbought and oversold conditions over multiple timeframes (e.g., 1-hour, daily, or weekly charts), recognizing patterns that lead to reversals.
• Convolutional Neural Networks (CNNs): CNNs can be applied to analyze Forex charts, detecting patterns (such as support and resistance levels) that might suggest an overbought or oversold condition is likely to trigger a reversal.
• Autoencoders: Used for anomaly detection, autoencoders can identify unusual price movements or deviations from historical price trends that indicate overbought or oversold conditions.
3. Key Indicators for Overbought/Oversold Detection
While AI models use a variety of data, the following technical indicators are commonly used in conjunction with AI models to identify overbought and oversold conditions:
• RSI (Relative Strength Index): The RSI is a momentum oscillator that moves between 0 and 100. Readings above 70 are considered overbought, and readings below 30 are considered oversold. AI can detect when the RSI is approaching these critical levels and predict potential price reversals.
• Stochastic Oscillator: Similar to RSI, this oscillator compares a currency’s closing price to its price range over a specific period. Overbought conditions are indicated when the value exceeds 80, and oversold conditions occur when it is below 20.
• CCI (Commodity Channel Index): This indicator helps to identify cyclical trends in a market. Readings above +100 suggest an overbought market, while readings below -100 signal an oversold market.
• Bollinger Bands: Price touching or exceeding the upper band often suggests overbought conditions, while touching or falling below the lower band suggests oversold conditions.
• Moving Average Convergence Divergence (MACD): MACD can help identify potential reversals. When the MACD crosses below its signal line, it can indicate an oversold condition, and when it crosses above, it may suggest an overbought condition.
4. Data Sources for AI-Based Overbought/Oversold Prediction
AI models analyze various data sources to detect overbought and oversold conditions:
• Price Data: Historical price movements, including OHLC (Open, High, Low, Close), help detect price extremes that suggest overbought or oversold conditions.
• Technical Indicators: RSI, Stochastic, CCI, MACD, Bollinger Bands, and other momentum indicators.
• Volume Data: Volume spikes can confirm or invalidate overbought or oversold signals. AI models use volume data in conjunction with price data to provide more accurate predictions.
• Sentiment Analysis: Sentiment derived from financial news, social media, and macroeconomic reports can indicate market optimism (leading to overbough
Like 0
I want to comment, too
Submit
0Comments

There is no comment yet. Make the first one.
Submit
There is no comment yet. Make the first one.