
2026-07-31 19:25
IndustryCandlestick Strength
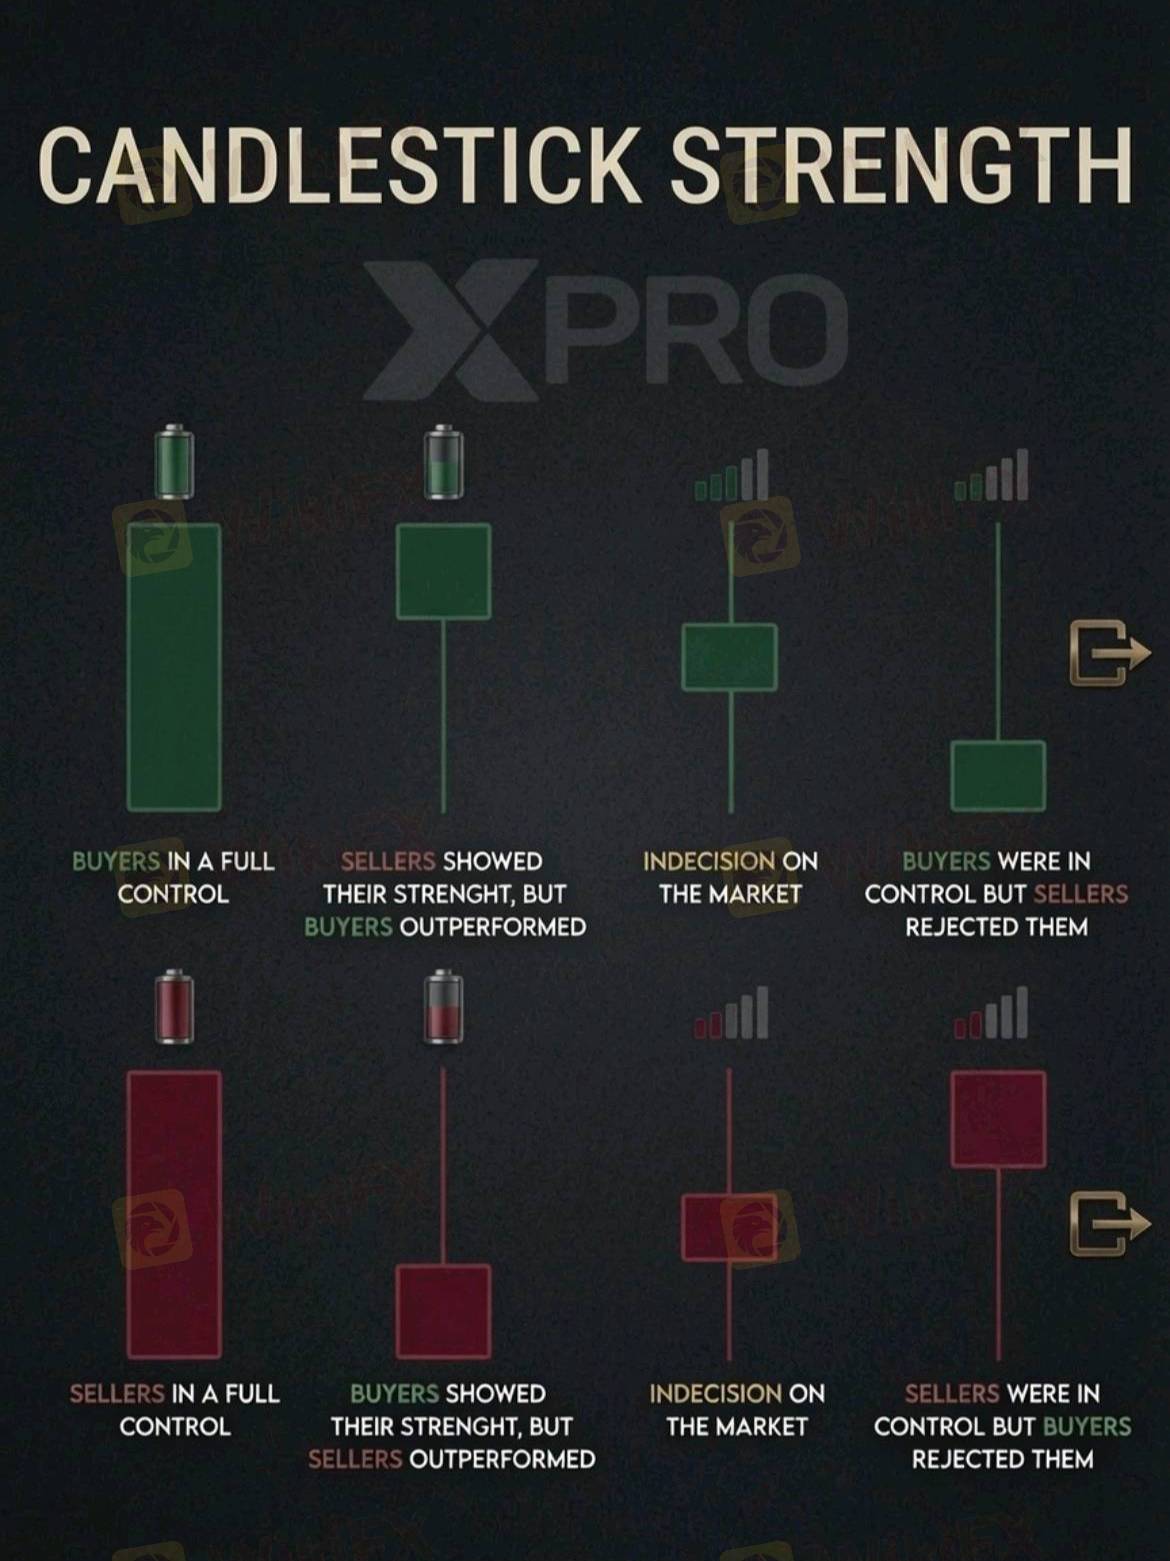
Understanding candlestick patterns goes beyond memorizing names like "Hammer" or "Doji." To truly read the market, you need to understand momentum—the ongoing battle between buyers (bulls) and sellers (bears).
Every candlestick tells a story about who was in control during a given timeframe. Let’s break down the spectrum of candlestick strength so you can spot trend continuations and potential reversals before they happen.
1. Full Control (Maximum Momentum)
🟢 Full Bullish Control
What it looks like: A long green body with little to no top or bottom wicks.
The Story: Buyers dominated the session from open to close. Bears couldn't push the price down at any point.
Trader Takeaway: Strong momentum in the direction of the trend. Continuation is highly likely.
🔴 Full Bearish Control
What it looks like: A long red body with almost no top or bottom wicks.
The Story: Sellers drove the price lower throughout the entire period without significant resistance from buyers.
Trader Takeaway: Aggressive selling pressure; watch for further downward movement.
2. Strong Push with Rejection Outperformance
🟢 Sellers Pushed, But Buyers Outperformed
What it looks like: A small green body at the top with a long lower wick.
The Story: Sellers tried to take control and pushed prices significantly lower, but buyers stepped in aggressively, swallowed the move, and closed higher.
Trader Takeaway: A classic bullish rejection pattern. Shows strong buying demand at lower prices.
🔴 Buyers Pushed, But Sellers Outperformed
What it looks like: A small red body at the bottom with a long upper wick.
The Story: Buyers drove the price up during the session, but sellers fought back fiercely and pushed the price back down to close near the lows.
Trader Takeaway: Heavy supply at higher levels; indicates selling pressure overriding buying attempts.
3. Market Indecision (Neutral State)
🟢 / 🔴 Indecision Candles
What it looks like: Small real body centered between upper and lower wicks of roughly equal length.
The Story: Both buyers and sellers tried to take control during the period, but neither side could hold their ground.
Trader Takeaway: Equilibrium between bulls and bears. Prepare for a consolidation or wait for a breakout candle to confirm the next direction.
4. Failed Moves & Rejections (Weakening Control)
🟢 Buyers Controlled, But Sellers Rejected
What it looks like: A small green body at the bottom with a long upper wick.
The Story: Buyers had the upper hand early on, but sellers stepped in strongly to push the price back down before the close.
Trader Takeaway: Buying momentum is exhausting. Even though it closed green, the long upper shadow signals growing bearish resistance.
🔴 Sellers Controlled, But Buyers Rejected
What it looks like: A small red body at the top with a long lower wick.
The Story: Sellers drove prices lower, but buyers rejected those low prices and pushed the market back up toward the open.
Trader Takeaway: Selling pressure is weakening. Even with a red body, the long lower shadow points to underlying buying strength.
Like 0

ThexproLLC
Trader
Hot content
Industry
Event-A comment a day,Keep rewards worthy up to$27
Industry
Nigeria Event Giveaway-Win₦5000 Mobilephone Credit
Industry
Nigeria Event Giveaway-Win ₦2500 MobilePhoneCredit
Industry
South Africa Event-Come&Win 240ZAR Phone Credit
Industry
Nigeria Event-Discuss Forex&Win2500NGN PhoneCredit
Industry
[Nigeria Event]Discuss&win 2500 Naira Phone Credit
Forum category

Platform

Exhibition

Agent

Recruitment

EA

Industry

Market

Index
Candlestick Strength
United Kingdom | 2026-07-31 19:25Understanding candlestick patterns goes beyond memorizing names like "Hammer" or "Doji." To truly read the market, you need to understand momentum—the ongoing battle between buyers (bulls) and sellers (bears).
Every candlestick tells a story about who was in control during a given timeframe. Let’s break down the spectrum of candlestick strength so you can spot trend continuations and potential reversals before they happen.
1. Full Control (Maximum Momentum)
🟢 Full Bullish Control
What it looks like: A long green body with little to no top or bottom wicks.
The Story: Buyers dominated the session from open to close. Bears couldn't push the price down at any point.
Trader Takeaway: Strong momentum in the direction of the trend. Continuation is highly likely.
🔴 Full Bearish Control
What it looks like: A long red body with almost no top or bottom wicks.
The Story: Sellers drove the price lower throughout the entire period without significant resistance from buyers.
Trader Takeaway: Aggressive selling pressure; watch for further downward movement.
2. Strong Push with Rejection Outperformance
🟢 Sellers Pushed, But Buyers Outperformed
What it looks like: A small green body at the top with a long lower wick.
The Story: Sellers tried to take control and pushed prices significantly lower, but buyers stepped in aggressively, swallowed the move, and closed higher.
Trader Takeaway: A classic bullish rejection pattern. Shows strong buying demand at lower prices.
🔴 Buyers Pushed, But Sellers Outperformed
What it looks like: A small red body at the bottom with a long upper wick.
The Story: Buyers drove the price up during the session, but sellers fought back fiercely and pushed the price back down to close near the lows.
Trader Takeaway: Heavy supply at higher levels; indicates selling pressure overriding buying attempts.
3. Market Indecision (Neutral State)
🟢 / 🔴 Indecision Candles
What it looks like: Small real body centered between upper and lower wicks of roughly equal length.
The Story: Both buyers and sellers tried to take control during the period, but neither side could hold their ground.
Trader Takeaway: Equilibrium between bulls and bears. Prepare for a consolidation or wait for a breakout candle to confirm the next direction.
4. Failed Moves & Rejections (Weakening Control)
🟢 Buyers Controlled, But Sellers Rejected
What it looks like: A small green body at the bottom with a long upper wick.
The Story: Buyers had the upper hand early on, but sellers stepped in strongly to push the price back down before the close.
Trader Takeaway: Buying momentum is exhausting. Even though it closed green, the long upper shadow signals growing bearish resistance.
🔴 Sellers Controlled, But Buyers Rejected
What it looks like: A small red body at the top with a long lower wick.
The Story: Sellers drove prices lower, but buyers rejected those low prices and pushed the market back up toward the open.
Trader Takeaway: Selling pressure is weakening. Even with a red body, the long lower shadow points to underlying buying strength.
Like 0
I want to comment, too
Submit
0Comments

There is no comment yet. Make the first one.
Submit
There is no comment yet. Make the first one.