WIKIFX REPORT: U.S. oil output rises 1.7% June to highest since April 2020
Abstract:U.S. crude oil production rose in June by 1.7% to its highest since April 2020, according to a monthly report from the U.S. Energy Information Administration on Wednesday last week
U.S. crude oil production rose in June by 1.7% to its highest since April 2020, according to a monthly report from the U.S. Energy Information Administration on Wednesday last week
HEADLINES
• Dollar dips, but on track for third-straight monthly gain
• Rate hike rush pushes gold to longest monthly losing streak in 4 years
• U.S. oil output rises 1.7% June to highest since April 2020 -EIA
• Wall Street struggles for direction on rate hike jitters
• Treasury yields are little changed after ADP reports hiring slowdown in August
• EUR/USD to retest the 0.9900/10 zone on a sustained push under 0.9985 – Scotiabank
• GBPUSD Near Term: Downside favored
Dollar dips, but on track for third-straight monthly gain
The dollar dipped against a basket of peer currencies on Wednesday, but was on track for its third-straight monthly rise, as traders brace for more oversized interest rate hikes from the U.S. Federal Reserve.
The dollar index , which measures the greenback against a basket of six currencies, was last down 0.184% at 108.56, after earlier having come within a whisker of Monday's two-decade peak of 109.48.
The index is on track for a rise of over 3% in August, and its highest end-of-month closing level since May 2002.
COMMODITIES
Rate hike rush pushes gold to longest monthly losing streak in 4 years
Gold slipped on Wednesday en route to its longest run of monthly losses since 2018, pressured by aggressive rate hikes by major central banks across the world.
Spot gold fell 0.5% to $1,715.79 an ounce by 09:55 a.m. ET (1355 GMT). Bullion has lost about 3% so far in August, and was set for its fifth straight month of declines.
U.S. gold futures shed 0.6% to $1,726.70.
Its getting much more clearer that central banks are going to be aggressive with tightening due to unprecedented inflationary pressure, which is not good for gold, said Edward Moya, senior analyst with OANDA.
ENERGY
U.S. oil output rises 1.7% June to highest since April 2020 -EIA
U.S. crude oil production rose in June by 1.7% to its highest since April 2020, according to a monthly report from the U.S. Energy Information Administration on Wednesday.
Oil production rose to about 11.8 million barrels per day in June from about 11.6 million bpd the month prior, the report showed. Producers cut back drastically on output in 2020 after pandemic lockdowns slashed demand, and companies have been gradually boosting production.
Production in North Dakota rose 3.4% to about 1.1 million barrels per day in June, highest since March, the report showed.
STOCKS
Wall Street struggles for direction on rate hike jitters
U.S. stock indexes struggled for direction on Wednesday and were set for sharp monthly declines as investors worried how much the Federal Reserve will hike interest rates to tame inflation, while chipmakers slid after tepid forecasts from Seagate and HP Inc.
The three main indexes were on pace for their worst August performance since 2015, with the tech-heavy Nasdaq (.IXIC) down 3.9% after Fed Chair Jerome Powell's blunt and hawkish remarks on Friday about keeping monetary policy tight “for some time” quashed hopes of more modest rate hikes.
Treasury yields are little changed after ADP reports hiring slowdown in August
U.S. Treasury yields were little changed on Wednesday after ADP reported a slowdown in hiring for the month of August
The yield on the 10-year note rose was less than 1 basis point higher at 3.117%, after beginning the month at about 2.6%. The yield on the 30-year Treasury bond was up 1 basis point to 3.231%.
Meanwhile, the yield on the 2-year Treasury note moved 2 basis points lower to 3.438%, after it reached a near-15-year high the previous day. Yields move inversely to prices, and a basis point is equal to 0.01%.
ANALYSIS
EUR/USD to retest the 0.9900/10 zone on a sustained push under 0.9985 – Scotiabank
“After another failed test of 1.0050 earlier in the session (minor double top), a sustained push under 0.9985 (neckline trigger) will tilt risks towards a retest of the 0.9900/10 area.”
“Swaps are not yet fully priced for a 75 bps hike, reflecting 67 bps of tightening at the Sep meeting, but the trend is leaning towards the risk of a more aggressive hike which may provide the EUR with some underpinning below 1.00 for now.”
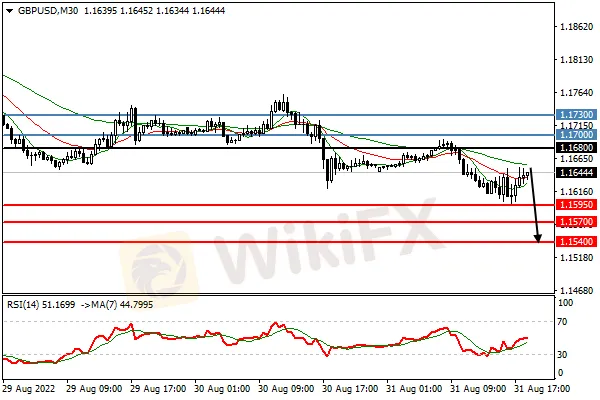
CHART
GBPUSD Near Term: Downside favored
Technical View: Short position below 1.168. Target 1.1595. Conversely, break above 1.168, to open 1.17.

Read more
Pepperstone Review 2026: Massive Deposit & Withdrawal Complaints Against This Regulated Broker
Have you experienced issues with Pepperstone deposit & withdrawal processing? From your experience, do you feel that the Australia-based forex broker causes losses to its clients? Did the brokerage entity freeze your account and give you a margin call? All these trading allegations have been rampant on broker review platforms such as WikiFX. This Pepperstone review article takes a close look at the user complaints, especially in 2026. Additionally, we have given an overview of the regulatory framework under which the brokerage entity operates.

Wundersys vs tradgrip: Two Offshore Newcomers Go Head to Head — and Neither Brings Home a Trophy
Some broker comparisons end with a confident "go with this one." This is not one of them — and that honesty is exactly what makes it worth reading. Wundersys and tradgrip are two young, offshore-registered brokers that keep popping up in front of beginner traders, often through aggressive online marketing. Both promise the usual buffet: tight spreads, generous leverage, multiple account tiers. And both, according to WikiFX, sit near the very bottom of the safety scale. So instead of crowning a champion, this comparison is really about something more useful: learning to read the warning signs, understanding the small differences that still matter, and knowing why "the better of two risky options" is still a conversation about risk.
The 6 Lowest-Commission Forex Brokers South Asian Traders Are Flocking To in 2026
If you trade forex from India, Pakistan, Bangladesh, Sri Lanka, or Nepal, you already know the quiet truth that eats into every trader's results: it is not just the market that decides whether you profit — it is the cost of getting in and out of each trade. Shave a couple of dollars off your commission on every lot, multiply it across hundreds of trades a year, and you are looking at the difference between a strategy that works and one that bleeds out slowly. South Asian traders are some of the most cost-conscious in the world, and rightly so. So we pulled the data on the brokers most often recommended for the region, cross-checked every name on WikiFX, and ranked them by the one number that matters most here: what they actually charge you to trade. Before the list, one quick lesson that will make this whole ranking click.

XPO Fund Wants $10,000 Before You Trade a Single Real Dollar — Read This Stunning Revelation
If you have spent even a week inside trading communities lately, you already know the pitch by heart. Pass a quick "challenge," get handed a funded account worth tens of thousands of dollars, and keep up to 80% of everything you make. No risking your own savings, no slow grind of building capital from scratch — just skill, a small fee, and a fast track to the big leagues. It is the exact dream every new trader is secretly chasing, and an entire industry has sprung up to sell it. XPO Fund is one of the louder voices selling that story right now. Its website is slick, its plans sound generous, and its marketing leans hard on words like "industry's lowest fee" and "fast payouts." But before you reach for your card, there is one number sitting quietly on this firm's profile — a number it would rather you scroll past — that every experienced trader would beg you to look at first. And no, it is not the profit split. Let's pull XPO Fund apart piece by piece: what it actually is, who is real
WikiFX Broker
Latest News
Keeping Your Forex Profits Safe With Trailing Stop Losses
 WikiFX
Review 2026: Japan FSA Regulation, Platform Access, and Complaint Signals
WikiFXHEADWAY Review: Broker Complaints Point to Withdrawals, Zeroed Balances, and Login Blocks
WikiFXIndian Stocks Take a Beating, Sensex Falls by Over 600 Points Today: Check Out Why
WikiFXDollar Hits Two-Month High Amid Surging Yields
WikiFXGetting Started in Forex: Understanding Currency Pairs, Central Banks, and Legal Risks
WikiFXAssetsFX Review 2026: Unregulated Status, Withdrawal Complaints, and Extreme Risk Signals
WikiFXNews Update: LTCG on Government Securities Slashed to Zero
WikiFXCySEC Withdraws Conotoxia Ltd Licence
WikiFXVITTAVERSE Review 2026: Is This Forex Broker Safe?
WikiFXRate Calc

