Technical Analysis & Forecast 27.02.2023
Abstract:The currency pair has completed a wave of decline to 1.0550. As of yesterday the market might demonstrate a link of correction to 1.0590 and go down to 1.0490. Then a new wave of correction to 1.0705 should start, followed by a decline to 1.0380.

EURUSD, “Euro vs US Dollar”
The currency pair has completed a wave of decline to 1.0550. As of yesterday the market might demonstrate a link of correction to 1.0590 and go down to 1.0490. Then a new wave of correction to 1.0705 should start, followed by a decline to 1.0380.

GBPUSD, “Great Britain Pound vs US Dollar”
The currency pair has completed a wave of decline to 1.1965. Yesterday a consolidation range may form under this level. Then a decline to 1.1890 should start. And with a breakaway of this level the wave should continue to 1.1796. After this level is reached, a wave of correction to 1.1965 should begin.

USDJPY, “US Dollar vs Japanese Yen”
The currency pair has completed a link of growth to 136.53. A correction to 135.30 is not excluded. Then a wave of growth should develop to 137.50. After this level is reached, a correction to 135.25 should begin.

USDCHF, “US Dollar vs Swiss Franc”
The currency pair has completed a structure of growth to 0.9417. Yesterday the market is consolidating under this level. With an escape downwards, a correction to 0.9320 should follow. With an escape upwards, the wave should continue to 0.9568.

AUDUSD, “Australian Dollar vs US Dollar”
The currency pair has completed a wave of decline to 0.6700. As of yesterday the market can form a link of growth to 0.6800. This link is interpreted as a collection. After the correction is over, a link of decline to 0.6600 might begin.

BRENT
Crude oil has completed a wave of growth to 82.90 and a correction to 82.40. Yesterday a wave of growth to 83.63 should start. Then a correction to 82.20 and growth to 86.06 should follow. The goal is local.

XAUUSD, “Gold vs US Dollar”
Gold has completed a link of decline to 1806.66. Yesterday a correction to 1817.37 is not excluded. Then a decline to 1805.00 and a wave of growth to 1825.75 should follow.

S&P 500
The stock index has completed a link of decline to 3942.5. Yesterday a consolidation range had formed above this level. With an escape upwards, a pathway to 4000.0 should open. Then a decline to 3900.0 should follow. With an escape downwards, a pathway down to 3900.0 should open right away, from where the trend might develop to 3824.0.

Note: Traders are expected to know that all the Forecasts presented in this section only reflect the authors private opinion and should not be considered as guidance for trading. Therefore you are advised to further your research for better analysis.


Read more
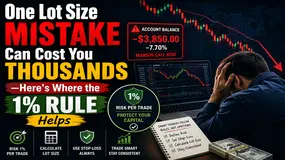
One Lot Size Mistake Can Cost You Thousands—Here's Where the 1% Rule Helps
Switched from one trading strategy to another but could not avert heavy losses? Wondering what went wrong despite your market analysis being spot on? It may not be a strategic issue then. It may just be that you chose the wrong lot size. Yes, a single oversized position can get your account exposed to far greater risks than you may imagine. You may be moved by the impressive profits with increasing lot sizes. But by doing so, you also invite a proportionate rise in losses. This is where you need to apply the essential 1% risk management principle. This rule helps you assess how much you can afford to lose if a trade does not go as planned.

Your Backtesting Results Mean Nothing If You Ignore This One Live Trading Reality
Backtesting remains one of the primary skills forex traders learn. By implementing a trading strategy based on historical currency pair price information, traders can view their past performance. The strategy leading to consistent profits during backtesting can raise confidence and lay a structured approach to the forex market. However, the path is not as simple as it may sound. Several traders tend to meet a harsh reality when transitioning to live trading. The strategy that seemed almost flawless on historical charts suddenly fails to deliver the results it did before. The sudden difference may not necessarily be because of a poor strategy. Rather, it indicates limitations concerning backtesting and several factors that play their part in a live market where conditions change frequently. It is thus important to understand these differences so that you can set realistic expectations and work on to achieve consistent success.

Can AI Really Improve Forex Trading? The Benefits, Risks and Hidden Limitations
We are living in the age of artificial intelligence, where everything including financial matters such as forex are rapidly influenced by this phenomenon. AI-powered tools are here to identify numerous trading opportunities and analyze thousands of data, all in seconds, becoming the preferred option for both retail and institutional traders. Regardless of its immense benefits, traders often question - Whether the AI can truly transform their forex trading experience or is it just like another technology offering scope for unrealistic expectations? While the AI can ensure faster trading and more informed decisions, it is never a sure shot way to profits. As a trader, you need to understand both the strengths and limitations of AI when it comes to generating real wealth.

Copy Trading Gone Wrong? The Mistakes That Could Wipe Out Your Entire Trading Account
We all love trading geniuses and their strategies that earn them profits season after season. And we also love following them to make our investment journey seamless. Copy trading is one such tactic that beginners employ to enter the forex market. What do most of them usually do? They pick an experienced investor from the list and let the platform replicate every trade automatically. The fact that experienced traders continually earn profits, the feeling of copying their trades remains intense. However, the uncertain forex landscape can bite you hard by simply copying trades and not focusing on technical analysis and the charts during the day. Beginners can have a set of preconceived notions that can potentially open the gate for losses. In this article, we have highlighted such mistakes traders should avoid.
WikiFX Broker
Latest News
Yen Surges on Pension Plan and Strong Inflation
 WikiFX
France’s AMF Warns Against 16 Unauthorized Online Investment Entities
WikiFXCan Meta Escape a US$610 Million WhatsApp Scam Lawsuit?
WikiFXHow the 3-Bullet Card Stops Forex Overtrading
WikiFXTRADE.COM Review 2026: Regulatory Status and Severe Withdrawal Complaints
WikiFXBank Customers Win Back RM211,000 After Insider Fraud
WikiFXFunding Pips Review 2026: Is This Forex Broker Safe?
WikiFXCash, Luxury and Live Streams: Malaysian Police Tighten Watch on Social Media Millionaires
WikiFX⚽💱 World Cup · Forex Predict & Win Event
WikiFXWikiEXPO Hong Kong 2026 Set to Open, Bringing Together Global Fintech Leaders to Explore the Future
WikiFXRate Calc

