
2020-05-06 09:47
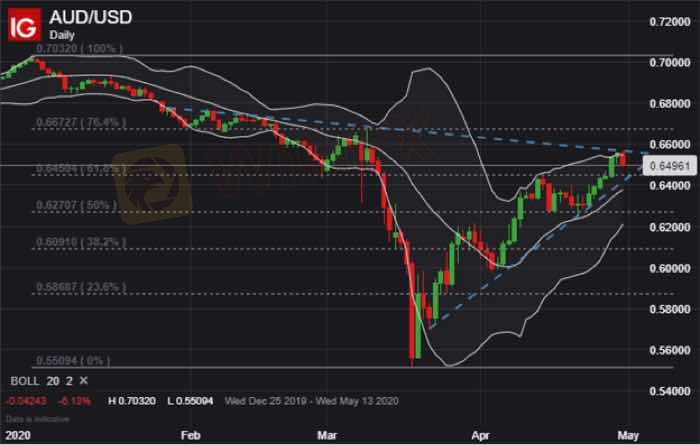
Teknikal na indeksAUD/USD PRICE CHART: DAILY TIME FRAME (DECEMBER 20
Zooming in on a daily AUD/USD chart shows the Australian Dollar is already starting to edge lower with a bearish reaction to its upper Bollinger Band near the 0.6500 price level. Technical support, underpinned by the 61.8% Fibonacci retracement of its year-to-date trading range, may provide AUD/USD a degree of buoyancy. Although, Australian Dollar selling pressure could accelerate if spot AUD/USD price action invalidates its short-term bullish trend noted by the recent series of higher lows.
Katulad 1

TPKNX
Mga kalahok
Mainit na nilalaman
Pagsusuri ng merkado
Dogecoin cheers coinbase listing as Bitcoin’s range play continues
Pagsusuri ng merkado
Bitcoin's price is not the only number going up
Pagsusuri ng merkado
Grayscale commits to converting GBTC into Bitcoin ETF:
Pagsusuri ng merkado
Theta Price Prediction:
Pagsusuri ng merkado
How to Research Stocks:
Pagsusuri ng merkado
Bitcoin (BTC), Ethereum (ETH) Forecast:
Kategorya ng forum

Plataporma

Eksibisyon

Ahente

pangangalap

EA

Industriya

Merkado

talatuntunan
AUD/USD PRICE CHART: DAILY TIME FRAME (DECEMBER 20
Estados Unidos | 2020-05-06 09:47Katulad 1
Gusto kong magkomento din
Ipasa
0Mga komento

Wala pang komento. Gawin ang una.
Ipasa
Wala pang komento. Gawin ang una.