
2025-02-06 15:30
IndustriyaTrading with Elliott Wave Theory
#firstdealofthenewyearFateema
Elliott Wave Theory (EWT) is a powerful technical analysis tool used in trading to predict market movements by identifying repeating wave patterns. Developed by Ralph Nelson Elliott in the 1930s, the theory suggests that financial markets move in fractal patterns based on investor psychology.
Basic Structure of Elliott Wave Theory
Elliott Wave Theory divides price movements into two main phases:
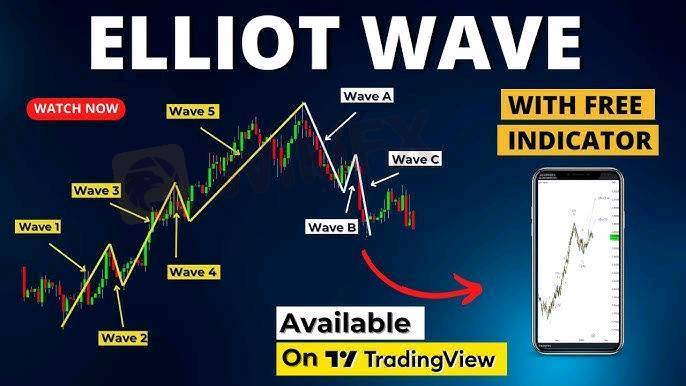
1. Impulse Waves (5-Wave Pattern)
These waves move in the direction of the main trend.
Consists of five waves:
Wave 1: Initial move in the direction of the trend.
Wave 2: Retracement but not beyond the start of Wave 1.
Wave 3: Strongest and longest wave (often extends).
Wave 4: Shallow correction, often sideways.
Wave 5: Final wave in the trend, completing the move.
2. Corrective Waves (3-Wave Pattern)
These waves move against the main trend.
Consists of three waves:
Wave A: Initial move against the trend.
Wave B: Temporary retracement.
Wave C: Final move completing the correction.
Elliott Wave Trading Strategies
1. Identifying the Trend (Impulse Wave Trading)
Enter during Wave 2 pullback or Wave 4 correction.
Ride Wave 3 (strongest move) for maximum profit.
Use Fibonacci retracements to identify entry points.
2. Trading the Correction (Counter-Trend Trading)
Identify corrective patterns (Zigzag, Flat, Triangle).
Short-sell at the end of Wave B or enter long at the end of Wave C.
3. Using Fibonacci for Confirmation
Wave 2 often retraces 50%-61.8% of Wave 1.
Wave 3 often extends 161.8% of Wave 1.
Wave 4 retraces 23.6%-38.2% of Wave 3.
Wave 5 can extend 61.8%-100% of Wave 1-3.
Best Indicators to Use with Elliott Wave
Fibonacci Retracement/Extension (for price targets)
RSI (Relative Strength Index) (divergence at Wave 5)
MACD (Moving Average Convergence Divergence) (momentum confirmation)
Volume (higher in Wave 3, lower in Wave 4)
Challenges in Elliott Wave Trading
Requires experience in wave counting.
Market structure can be subjective.
Works best in trending markets.
Would you like me to analyze a specific chart or asset using Elliott Wave Theory?
Katulad 0

Aniema30
Mangangalakal
Mainit na nilalaman
Pagsusuri ng merkado
Dogecoin cheers coinbase listing as Bitcoin’s range play continues
Pagsusuri ng merkado
Grayscale commits to converting GBTC into Bitcoin ETF:
Pagsusuri ng merkado
Bitcoin's price is not the only number going up
Pagsusuri ng merkado
Theta Price Prediction:
Pagsusuri ng merkado
How to Research Stocks:
Pagsusuri ng merkado
Bitcoin (BTC), Ethereum (ETH) Forecast:
Kategorya ng forum

Plataporma

Eksibisyon

Ahente

pangangalap

EA

Industriya

Merkado

talatuntunan
Trading with Elliott Wave Theory
Nigeria | 2025-02-06 15:30#firstdealofthenewyearFateema
Elliott Wave Theory (EWT) is a powerful technical analysis tool used in trading to predict market movements by identifying repeating wave patterns. Developed by Ralph Nelson Elliott in the 1930s, the theory suggests that financial markets move in fractal patterns based on investor psychology.
Basic Structure of Elliott Wave Theory
Elliott Wave Theory divides price movements into two main phases:
1. Impulse Waves (5-Wave Pattern)
These waves move in the direction of the main trend.
Consists of five waves:
Wave 1: Initial move in the direction of the trend.
Wave 2: Retracement but not beyond the start of Wave 1.
Wave 3: Strongest and longest wave (often extends).
Wave 4: Shallow correction, often sideways.
Wave 5: Final wave in the trend, completing the move.
2. Corrective Waves (3-Wave Pattern)
These waves move against the main trend.
Consists of three waves:
Wave A: Initial move against the trend.
Wave B: Temporary retracement.
Wave C: Final move completing the correction.
Elliott Wave Trading Strategies
1. Identifying the Trend (Impulse Wave Trading)
Enter during Wave 2 pullback or Wave 4 correction.
Ride Wave 3 (strongest move) for maximum profit.
Use Fibonacci retracements to identify entry points.
2. Trading the Correction (Counter-Trend Trading)
Identify corrective patterns (Zigzag, Flat, Triangle).
Short-sell at the end of Wave B or enter long at the end of Wave C.
3. Using Fibonacci for Confirmation
Wave 2 often retraces 50%-61.8% of Wave 1.
Wave 3 often extends 161.8% of Wave 1.
Wave 4 retraces 23.6%-38.2% of Wave 3.
Wave 5 can extend 61.8%-100% of Wave 1-3.
Best Indicators to Use with Elliott Wave
Fibonacci Retracement/Extension (for price targets)
RSI (Relative Strength Index) (divergence at Wave 5)
MACD (Moving Average Convergence Divergence) (momentum confirmation)
Volume (higher in Wave 3, lower in Wave 4)
Challenges in Elliott Wave Trading
Requires experience in wave counting.
Market structure can be subjective.
Works best in trending markets.
Would you like me to analyze a specific chart or asset using Elliott Wave Theory?
Katulad 0
Gusto kong magkomento din
Ipasa
0Mga komento

Wala pang komento. Gawin ang una.
Ipasa
Wala pang komento. Gawin ang una.