2024-12-23 13:39
A l'instar de l'industrie1⃣Introduction to Candlesticks 🔥
Candlesticks are a type of chart used in Forex trading to represent price movements over a specific time frame. Each candlestick gives us information about four key price points:
🔹Open: The price at the beginning of the time period.
🔹Close: The price at the end of the time period.
🔹High: The highest price during the time period.
🔹Low: The lowest price during the time period.
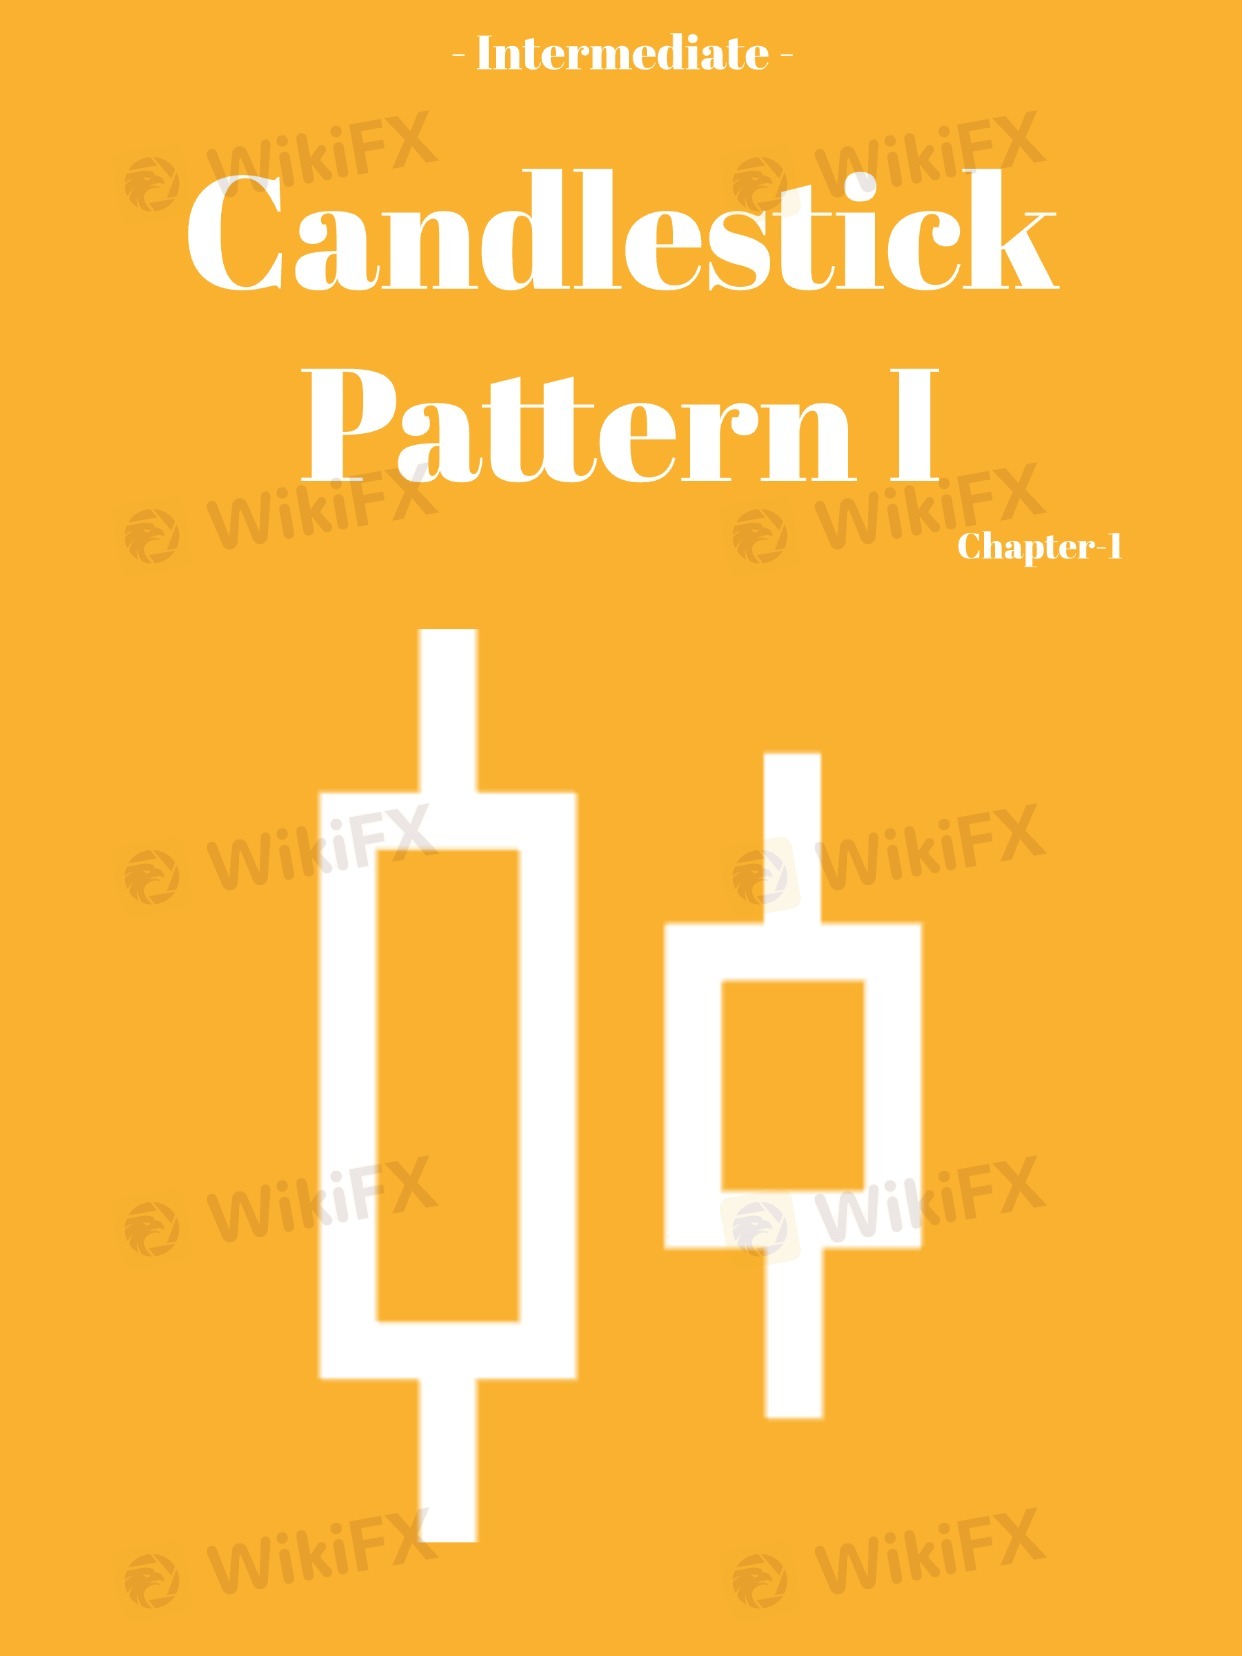
The candlestick body is the rectangular area between the open and close prices, and the wicks (or shadows) are the lines above and below the body, showing the highest and lowest prices during the time period.
Key Point: A green or white candlestick (bullish) means the price closed higher than it opened, showing buying pressure. A red or black candlestick (bearish) means the price closed lower than it opened, showing selling pressure. The longer the body, the stronger the trend. 📈
J'aime 0

Discussions recherchées
A l'instar de l'industrie
WikiFX recrute: Un(e) spécialiste e-marketing Forex à temps partiel
A l'instar de l'industrie
Tirages au sort WikiFX - Tentez votre chance pour gagner un crédit d’appel !
A l'instar de l'industrie
WikiFX recrute un(e) spécialiste marketing
A l'instar de l'industrie
Chemin à la fortune : Indications de l'activité Airdrop WikiBit
Analyse de marché
construction
A l'instar de l'industrie
Route à la Fortune : Indications de l'activité Airdrop Spécial WikiBit
Catégorisation des marchés

Plateformes

Signalement

Agents

Recrutement

EA

A l'instar de l'industrie

Marché

Indicateur
1⃣Introduction to Candlesticks 🔥
 Hong Kong | 2024-12-23 13:39
Candlesticks are a type of chart used in Forex trading to represent price movements over a specific time frame. Each candlestick gives us information about four key price points:
🔹Open: The price at the beginning of the time period.
🔹Close: The price at the end of the time period.
🔹High: The highest price during the time period.
🔹Low: The lowest price during the time period.
The candlestick body is the rectangular area between the open and close prices, and the wicks (or shadows) are the lines above and below the body, showing the highest and lowest prices during the time period.
Key Point: A green or white candlestick (bullish) means the price closed higher than it opened, showing buying pressure. A red or black candlestick (bearish) means the price closed lower than it opened, showing selling pressure. The longer the body, the stronger the trend. 📈
J'aime 0
Je veux faire un commentaire aussi.
Poser une question
0commentaires

Aucun commentaire pour l'instant. Soyez le premier de faire un commentaire !

Poser une question
Aucun commentaire pour l'instant. Soyez le premier de faire un commentaire !