
2025-01-30 18:31
A l'instar de l'industrieUsing Bollinger Bands in Crypto Trading
#firstdealofthenewyearFateema
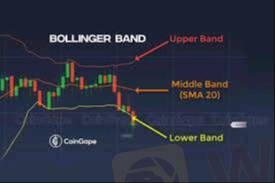
Bollinger Bands are a popular technical analysis tool used in crypto trading to identify potential price breakouts, overbought and oversold conditions, and market volatility. They consist of three lines:
1. Middle Band – A simple moving average (SMA), typically set to 20 periods.
2. Upper Band – Calculated as the SMA plus two standard deviations.
3. Lower Band – Calculated as the SMA minus two standard deviations.
How to Use Bollinger Bands in Crypto Trading
1. Identifying Overbought and Oversold Conditions
Price Near Upper Band → The asset may be overbought, signaling a potential pullback.
Price Near Lower Band → The asset may be oversold, indicating a possible bounce.
2. Bollinger Band Squeeze (Volatility Indicator)
Bands Contracting → Low volatility, possible upcoming breakout.
Bands Expanding → Increased volatility, confirming a trend continuation.
3. Breakout Trading Strategy
If the price breaks above the upper band with strong volume, it may signal a bullish breakout.
If the price breaks below the lower band with strong volume, it may indicate a bearish breakout.
4. Using Bollinger Bands with Other Indicators
RSI (Relative Strength Index): Confirms overbought/oversold conditions.
MACD (Moving Average Convergence Divergence): Helps validate breakout signals.
Support & Resistance Levels: Avoid false breakouts by checking key price levels.
Limitations
False signals can occur, so always combine Bollinger Bands with other indicators.
Does not predict trend direction, only volatility changes.
Would you like insights on applying Bollinger Bands in specific market conditions or assets?
J'aime 0

Estybest
交易者
Discussions recherchées
A l'instar de l'industrie
WikiFX recrute: Un(e) spécialiste e-marketing Forex à temps partiel
A l'instar de l'industrie
WikiFX recrute un(e) spécialiste marketing
A l'instar de l'industrie
Tirages au sort WikiFX - Tentez votre chance pour gagner un crédit d’appel !
A l'instar de l'industrie
Chemin à la fortune : Indications de l'activité Airdrop WikiBit
Analyse de marché
construction
A l'instar de l'industrie
Route à la Fortune : Indications de l'activité Airdrop Spécial WikiBit
Catégorisation des marchés

Plateformes

Signalement

Agents

Recrutement

EA

A l'instar de l'industrie

Marché

Indicateur
Using Bollinger Bands in Crypto Trading
Nigeria | 2025-01-30 18:31#firstdealofthenewyearFateema
Bollinger Bands are a popular technical analysis tool used in crypto trading to identify potential price breakouts, overbought and oversold conditions, and market volatility. They consist of three lines:
1. Middle Band – A simple moving average (SMA), typically set to 20 periods.
2. Upper Band – Calculated as the SMA plus two standard deviations.
3. Lower Band – Calculated as the SMA minus two standard deviations.
How to Use Bollinger Bands in Crypto Trading
1. Identifying Overbought and Oversold Conditions
Price Near Upper Band → The asset may be overbought, signaling a potential pullback.
Price Near Lower Band → The asset may be oversold, indicating a possible bounce.
2. Bollinger Band Squeeze (Volatility Indicator)
Bands Contracting → Low volatility, possible upcoming breakout.
Bands Expanding → Increased volatility, confirming a trend continuation.
3. Breakout Trading Strategy
If the price breaks above the upper band with strong volume, it may signal a bullish breakout.
If the price breaks below the lower band with strong volume, it may indicate a bearish breakout.
4. Using Bollinger Bands with Other Indicators
RSI (Relative Strength Index): Confirms overbought/oversold conditions.
MACD (Moving Average Convergence Divergence): Helps validate breakout signals.
Support & Resistance Levels: Avoid false breakouts by checking key price levels.
Limitations
False signals can occur, so always combine Bollinger Bands with other indicators.
Does not predict trend direction, only volatility changes.
Would you like insights on applying Bollinger Bands in specific market conditions or assets?
J'aime 0
Je veux faire un commentaire aussi.
Poser une question
0commentaires

Aucun commentaire pour l'instant. Soyez le premier de faire un commentaire !
Poser une question
Aucun commentaire pour l'instant. Soyez le premier de faire un commentaire !