
2025-10-27 16:00
A l'instar de l'industrieIDENTITY KEY LEVEL
#NewbieGuide
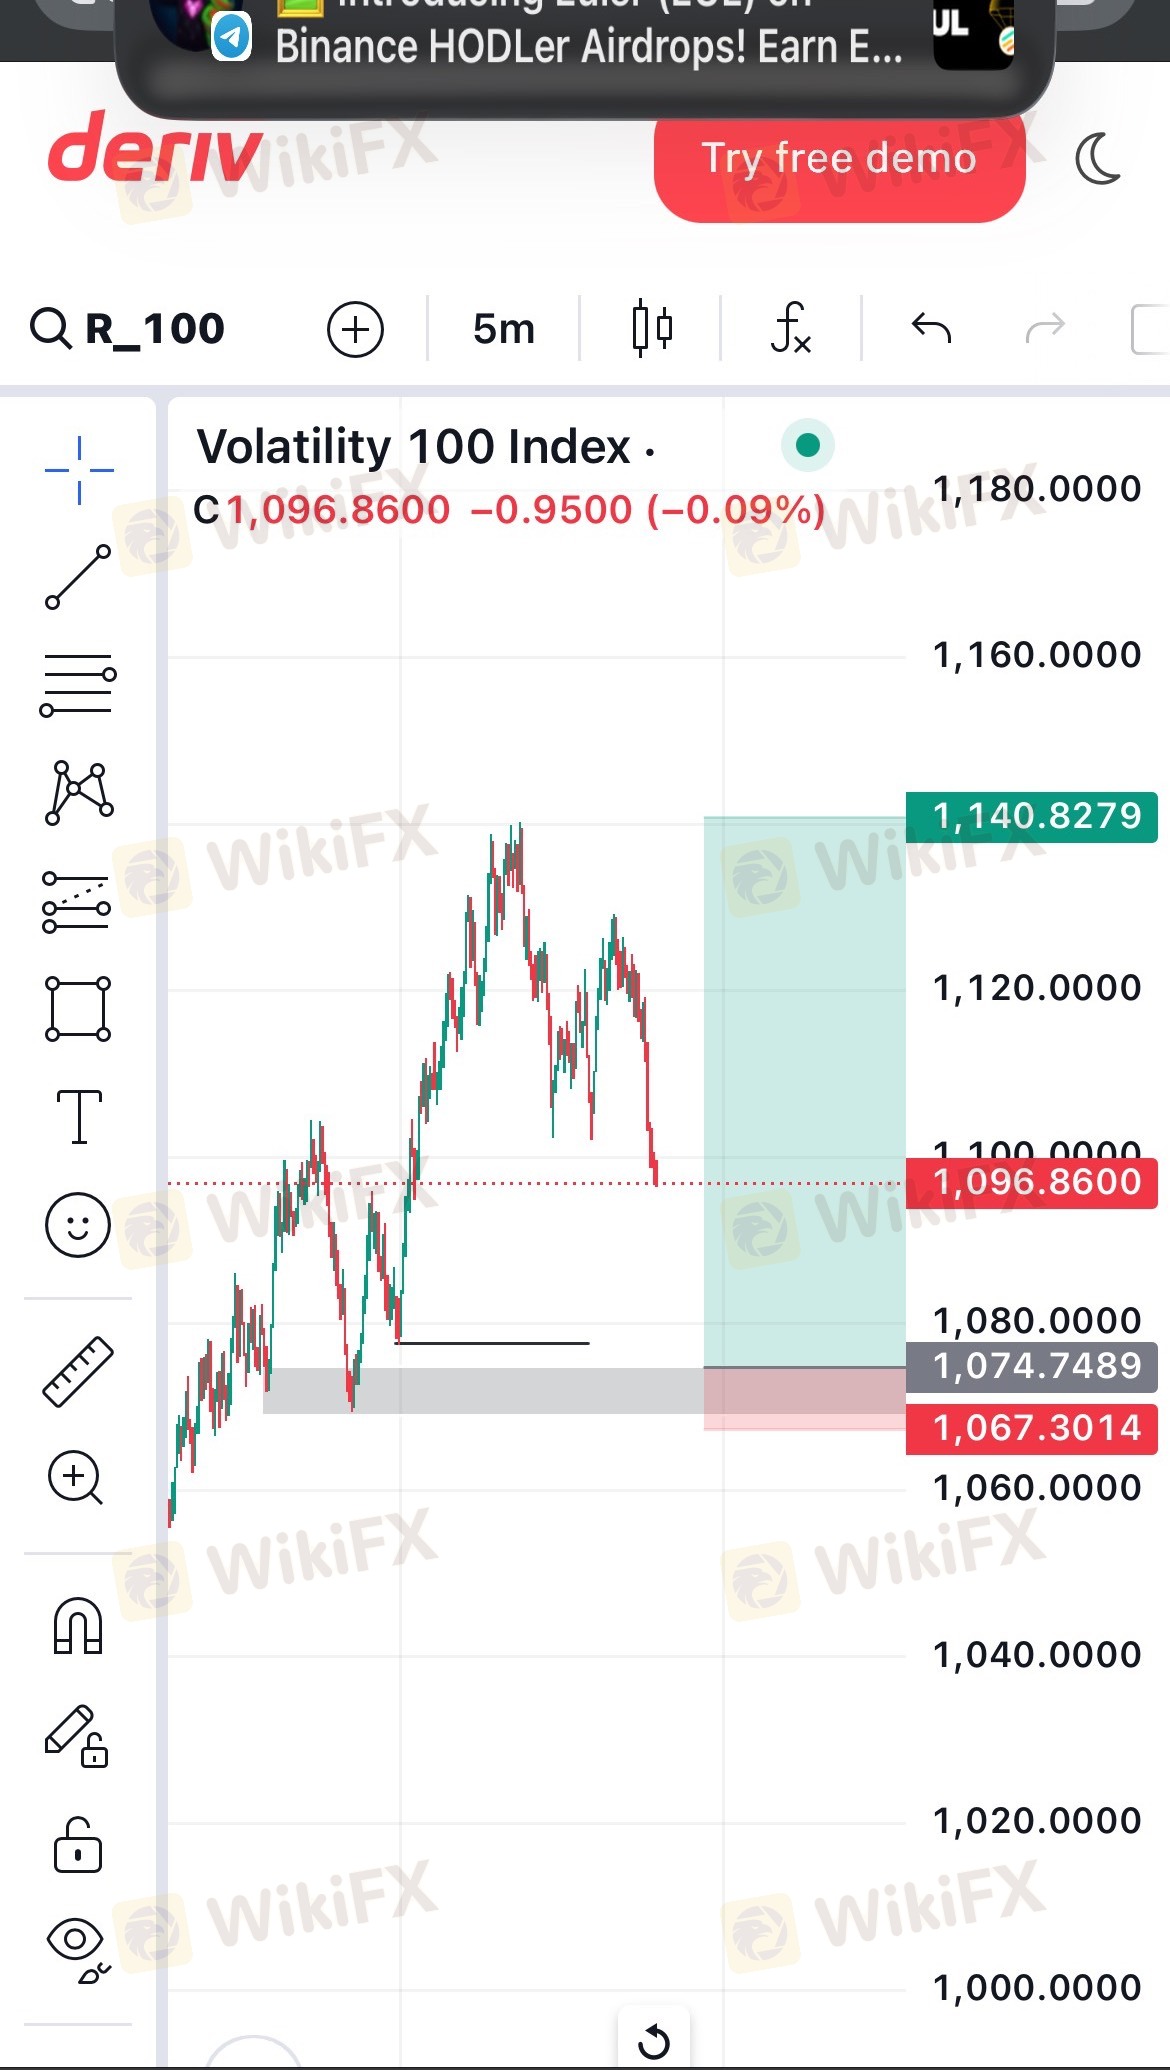
Start with understanding market structure. Learn how price moves in waves, forming trends (up, down, or sideways). Identify key areas like support (where price often stops falling) and resistance (where price often stops rising). These zones help you decide entry and exit points. Study candlestick patterns such as pin bars, engulfing candles, and dojis—they reveal how buyers and sellers are reacting at specific levels.
Next, learn how to read charts and indicators. Indicators like Moving Averages, RSI, MACD, and Bollinger Bands can guide you in spotting momentum, reversals, and overbought or oversold conditions. However, never rely solely on indicators—combine them with price action and confirmation signals.
J'aime 0

sartaz
交易者
Discussions recherchées
A l'instar de l'industrie
WikiFX recrute: Un(e) spécialiste e-marketing Forex à temps partiel
A l'instar de l'industrie
Tirages au sort WikiFX - Tentez votre chance pour gagner un crédit d’appel !
A l'instar de l'industrie
WikiFX recrute un(e) spécialiste marketing
A l'instar de l'industrie
Chemin à la fortune : Indications de l'activité Airdrop WikiBit
Analyse de marché
construction
A l'instar de l'industrie
Route à la Fortune : Indications de l'activité Airdrop Spécial WikiBit
Catégorisation des marchés

Plateformes

Signalement

Agents

Recrutement

EA

A l'instar de l'industrie

Marché

Indicateur
IDENTITY KEY LEVEL
Inde | 2025-10-27 16:00#NewbieGuide
Start with understanding market structure. Learn how price moves in waves, forming trends (up, down, or sideways). Identify key areas like support (where price often stops falling) and resistance (where price often stops rising). These zones help you decide entry and exit points. Study candlestick patterns such as pin bars, engulfing candles, and dojis—they reveal how buyers and sellers are reacting at specific levels.
Next, learn how to read charts and indicators. Indicators like Moving Averages, RSI, MACD, and Bollinger Bands can guide you in spotting momentum, reversals, and overbought or oversold conditions. However, never rely solely on indicators—combine them with price action and confirmation signals.
J'aime 0
Je veux faire un commentaire aussi.
Poser une question
0commentaires

Aucun commentaire pour l'instant. Soyez le premier de faire un commentaire !
Poser une question
Aucun commentaire pour l'instant. Soyez le premier de faire un commentaire !