2020-04-11 19:19
टेक्निकल इंडेक्सGold Price Forecast: Easy money will be made
After hesitating in the previous week, gold prices soared in these last few days, with spot gold trading as high as $ 1,690.23 a troy ounce, to close the week less than $ 10.00 below this last. The bright metal gained the most on Thursday, following the US Federal Reserve decision to announce another round on massive easing, this time in the form of loans of up to $2.3 trillion.
Following the announcement, US Federal Reserve Chief Powell offered a speech afterwards and reaffirmed that the central bank would continue to use all available tools to support the American economy until it recovers. Concerned about the high levels of unemployment the US may reach, Powell was overall confident that the situation will revert as soon as the pandemic is under control.
Gold futures, in the meantime, reached a 7.5 year high around $1,750.00 a troy ounce after the announcement, as the ongoing pandemic-related crisis, keeps fueling demand for the safe-haven metal. With the world’s economies in pause, fears or recession loom, hence, demand for gold will likely persist.
Excess of liquidity and shortage of physical gold
Meanwhile, gold supply remains subdued. This past week, several Swill refineries re-opened, but global demand keeps rising. And as central banks have turned on the printing machine, much of the excess of liquidity has already a place to go.
The extend of the global economic damage caused by the pandemic is yet to be seen, although nobody doubts it will be long and painful. In this scenario, gold is meant to keep on rallying.
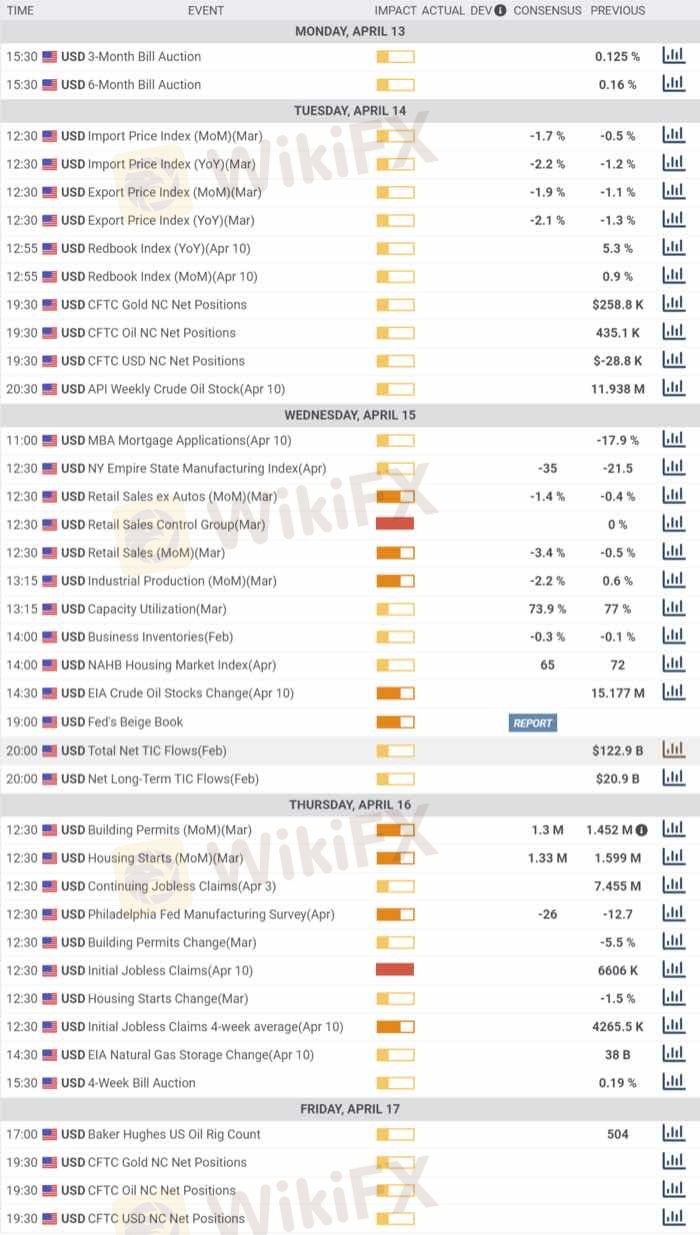
More hints on how the pandemic is hitting the world will be out next week, as the US will report March Retail Sales, and Initial Jobless Claims for the week ended March 3.
Spot Gold Technical Outlook
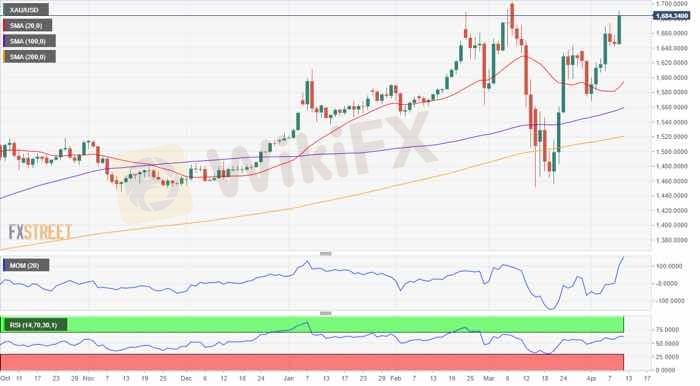
Trading at around 1,680, spot gold is close to the multi-year high set early Mach at 1.703.18. The commodity is bullish, with technicals aligned with fundamentals.
The weekly chart shows that it bottomed at around the 61.8% retracement of its latest weekly slump, at 1,606.60. It has continued to develop far above all of its moving averages, with the 20 SMA accelerating north. Technical indicators have resumed their advances within positive levels, although they lack enough strength to confirm a steeper advance.
In the daily chart, the Momentum indicator is partially losing its bullish strength in overbought levels, while the RSI maintains its strength upward at around 63. The 20 DMA has turned back north, although it’s barely picking up after trending lower for the past 5-weeks. Anyway, the larger moving averages maintain their bullish slopes.
The weekly high at 1,690 is the immediate resistance ahead of 1,703. Beyond this last, 1,795.80, the high from October 2012, comes at sight. Supports for the upcoming days come at 1,661 and the 1,640 price zone.
लाइक करें 1

TPKNX
Praktiker
गर्म सामग्री
इंडस्ट्री
विदेशी मुद्रा कहानी Forex story
इंडस्ट्री
User Survey Questionnaire
इंडस्ट्री
User Survey Questionnaire
इंडस्ट्री
User Survey Questionnaire
इंडस्ट्री
User Survey Questionnaire
इंडस्ट्री
Participate in the survey and claim your contribution rewards!
फोरम केटेगरी

प्लेटफॉर्म

एक्सहिबिशन

एजेंट

भर्ती करना

EA

इंडस्ट्री

मार्केट

इंडेक्स


प्रस्तुत
अभी तक कोई टिप्पणी नहीं है। पहले एक बनाओ।