2020-05-06 09:47
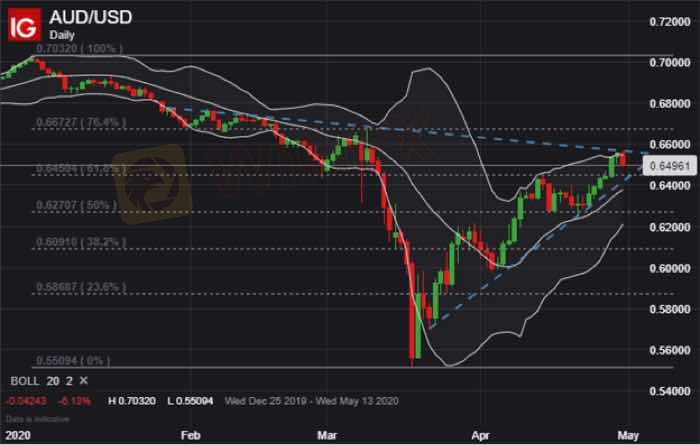
टेक्निकल इंडेक्सAUD/USD PRICE CHART: DAILY TIME FRAME (DECEMBER 20
Zooming in on a daily AUD/USD chart shows the Australian Dollar is already starting to edge lower with a bearish reaction to its upper Bollinger Band near the 0.6500 price level. Technical support, underpinned by the 61.8% Fibonacci retracement of its year-to-date trading range, may provide AUD/USD a degree of buoyancy. Although, Australian Dollar selling pressure could accelerate if spot AUD/USD price action invalidates its short-term bullish trend noted by the recent series of higher lows.
लाइक करें 1

TPKNX
प्रतिभागियों
गर्म सामग्री
इंडस्ट्री
विदेशी मुद्रा कहानी Forex story
इंडस्ट्री
User Survey Questionnaire
इंडस्ट्री
User Survey Questionnaire
इंडस्ट्री
User Survey Questionnaire
इंडस्ट्री
User Survey Questionnaire
इंडस्ट्री
Participate in the survey and claim your contribution rewards!
फोरम केटेगरी

प्लेटफॉर्म

एक्सहिबिशन

एजेंट

भर्ती करना

EA

इंडस्ट्री

मार्केट

इंडेक्स


प्रस्तुत
अभी तक कोई टिप्पणी नहीं है। पहले एक बनाओ।