2020-05-06 09:46
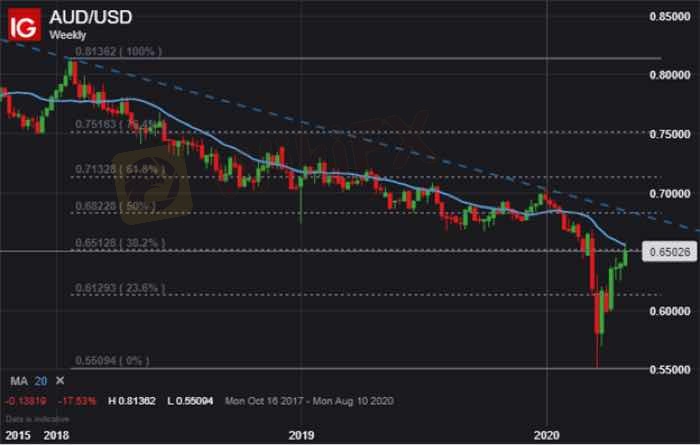
टेक्निकल इंडेक्सAUD/USD PRICE CHART: WEEKLY TIME FRAME (OCTOBER 20
The Australian Dollar faces a pivotal inflection point as AUD/USD price action rallies into a huge area of resistance. This technical barrier, which threatens to send AUD/USD recoiling back lower, is highlighted by a confluence of its 20-week moving average and 38.2% Fibonacci Retracement level of the January 2018 to March 2020 trading range.
लाइक करें 0

TPKNX
प्रतिभागियों
गर्म सामग्री
इंडस्ट्री
विदेशी मुद्रा कहानी Forex story
इंडस्ट्री
User Survey Questionnaire
इंडस्ट्री
User Survey Questionnaire
इंडस्ट्री
User Survey Questionnaire
इंडस्ट्री
User Survey Questionnaire
इंडस्ट्री
Participate in the survey and claim your contribution rewards!
फोरम केटेगरी

प्लेटफॉर्म

एक्सहिबिशन

एजेंट

भर्ती करना

EA

इंडस्ट्री

मार्केट

इंडेक्स


प्रस्तुत
अभी तक कोई टिप्पणी नहीं है। पहले एक बनाओ।