US OPENING BELLUS OPENING BELL 01-02-2023
Sommario:EUROPEAN SHARES REMAIN FLAT AHEAD OF THE KEY FED MEETING; EUROZONE INFLATION SLOWS MORE THAN EXPECTED WHILE THE USD AND VIX REMAIN AT PERIOD LOWS.

EUROPEAN SHARES REMAIN FLAT AHEAD OF THE KEY FED MEETING; EUROZONE INFLATION SLOWS MORE THAN EXPECTED WHILE THE USD AND VIX REMAIN AT PERIOD LOWS.
The opening bell refers to the moment a securities exchange opens for its normal daily trading session. Major European equities traded around parity this morning ahead of the US session, with the Dax advancing 0.11%, the Cac40 0.03% and the Eurostoxx 0.21%.
The market is waiting to see the outcome of the FED meeting this evening, with investors focusing on what Powell will say in his press conference. In particular, attention will need to be paid to possible references to any wording regarding future rate hikes and the timing with which these rates will remain so high. The market has recently risen by ‘reading’ the FED meeting as dovish in anticipation. So its performance will be determined as always by the degree to which these expectations will or will not be disappointed.
In the meantime, positive data for the Eurozone arrived in the morning, with inflation falling more than expected. Specifically, the annual figure came in at 8.5% against the expected 9%, while the monthly figure came in at -0.4% against the expected -0.3%. These data should not cause the ECB to alter its planned 50bp rate hike this week, but they could certainly affect the central banks forward guidance.
The Eurozone consumer price index dropped by 0.4% month-on-month during the period, matching the decrease seen in December. Economists had forecast a decline of 0.3%. Somewhere, the USD continues to trade on period lows around 101 (dollar index), as does the VIX, which doesnt seem to want to rise above the 20 mark. Beware of this data, volatility is very compressed at the moment, and these compressions always occur before solid expansions.
With regards to the macroeconomic calendar, investors attention today will be focused on the FED meeting, as already mentioned. Still, following the ADP non-farm employment change, the ISM manufacturing PMI, crude oil inventories and JOLTs job openings will also be necessary.
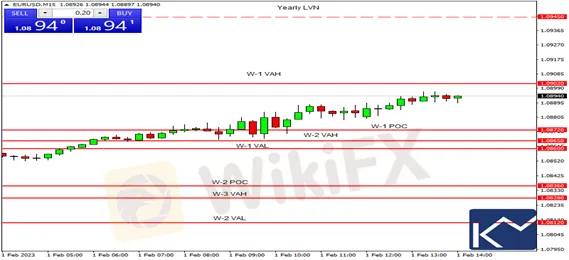
EURUSD, M15

The EURUSD recovered all yesterday mornings losses and closed positive. As for today, the most significant intraday support area is between the W-1 POC and the W-1 VAL. In contrast, the most critical intraday resistance is the W-1 VAH. From a technical point of view, as long as prices remain above the support, the most likely scenario is a continuation of the rise toward the resistance. If prices break the resistance and consolidate above it, they could target the yearly LVN around the 1.0945 mark. On the other hand, if prices drop below the W-1 VAL, they could fall to the W-2 POC.
Main intraday support areas where to look for long trades in case of a bullish candlestick pattern or short trades in case of a bearish candlestick pattern: 1.0872-1.0860, 1.0836, 1.0828, 1.0812.
Main intraday resistances areas where to look for short trades in case of a bearish candlestick pattern or long trades in case of a bullish candlestick pattern: 1.0902, 1.0945.
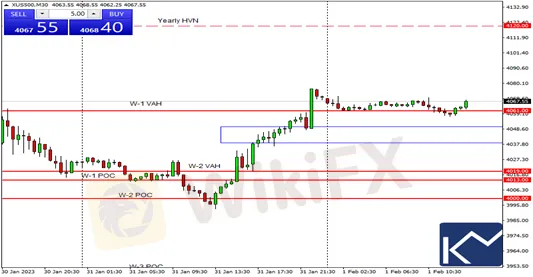
S&P500, M30

The S&P index rose above the resistance in the 4039-4050 area and posted a precise pullback before stretching above the W-1 VAH. As for today, the 4039-4050 area is the most significant intraday support. In contrast, the most crucial resistance is the yearly HVN. From a technical standpoint, as long as prices remain above the support, the most likely scenario is a continuation of the rise toward the resistance. On the flip side, if the index drop below the support, further declines could target the W-2 VAH.
Main intraday support areas where to look for long trades in case of a bullish candlestick pattern or short trades in case of a bearish candlestick pattern: 4061, 450-4039, 4019.
Main intraday resistances areas where to look for short trades in case of a bearish candlestick pattern or long trades in case of a bullish candlestick pattern: 4120.
Check some Key meaning:
POC= Point of Control
VAH= Value Area High
VAL= Value Area Low
LVN= Low Volume Node
HVN= High Volume Node
W-1= last week
W-2= two weeks ago
W-3= three weeks ago
D-1= yesterday
D-2= two days ago
D-3= three days ago

WikiFX Trader
FXTM
FOREX.com
Exness
DBG Markets
HTFX
CXM Trading
FXTM
FOREX.com
Exness
DBG Markets
HTFX
CXM Trading
WikiFX Trader
FXTM
FOREX.com
Exness
DBG Markets
HTFX
CXM Trading
FXTM
FOREX.com
Exness
DBG Markets
HTFX
CXM Trading
Rate Calc

