XAUUSD: Elliott wave analysis and forecast for 10.02.23 – 17.02.23
Sommario:The Elliott Wave theory is a form of technical analysis that looks for recurrent long-term price patterns related to persistent changes in investor sentiment and psychology. The theory identifies impulse waves that set up a pattern and corrective waves that oppose the larger trend.

The Elliott Wave theory is a form of technical analysis that looks for recurrent long-term price patterns related to persistent changes in investor sentiment and psychology. The theory identifies impulse waves that set up a pattern and corrective waves that oppose the larger trend.
Let's look at Elliott Theory for the pair of XAUUSD
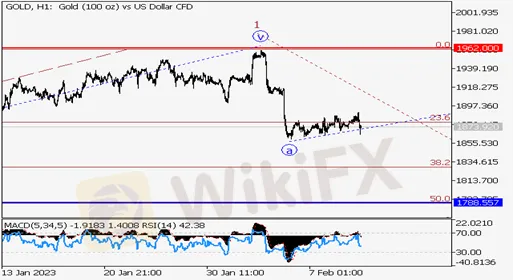
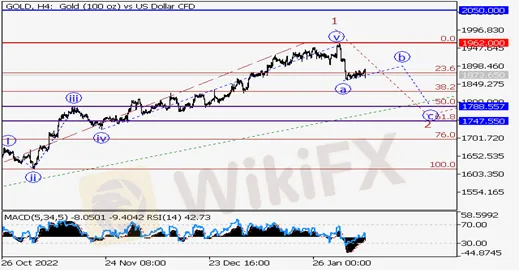
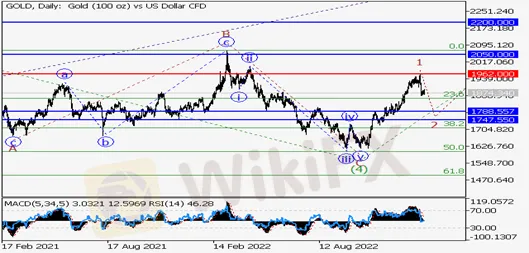
Main scenario: consider short positions from corrections below the level of 1962.00 with a target of 1788.55 – 1747.55.
Alternative scenario: breakout and consolidation above the level of 1962.00 will allow the pair to continue rising to the levels of 2050.00 – 2200.00.
Analysis: a descending correction appears to have formed as the fourth wave (4) of larger degree on the daily chart, with wave С of (4) completed and the fifth wave (5) unfolding inside. Apparently, the first wave of smaller degree 1 of (5) is formed on the H4 chart, and a local correction is developing as the second wave 2 of (5). On the H1 chart, apparently, wave a of 2 is formed, and wave b of 2 is developing at the moment. Once it's completed, the pair will continue to fall to the levels of 1788.55 – 1747.55 if the presumption is correct. The level of 1962.00 is critical in this scenario as a breakout will enable the pair to continue growing to the levels of 2050.00 – 2200.00.


Kindly note that the analysis provided above are just ones opinion and thoughts about the markets, which might not necessarily be accurate. Therefore it shouldn't considered as financial investment advice.

WikiFX Trader
VT Markets
IC Markets Global
FOREX.com
OANDA
Neex
STARTRADER
VT Markets
IC Markets Global
FOREX.com
OANDA
Neex
STARTRADER
WikiFX Trader
VT Markets
IC Markets Global
FOREX.com
OANDA
Neex
STARTRADER
VT Markets
IC Markets Global
FOREX.com
OANDA
Neex
STARTRADER
Rate Calc


