MHMarkets:The Palestinian-Israeli conflict has escalated, and spot gold has broken through the $2,000 mark.
Sommario:On Monday (October 30), at the end of the Asian Market, Iranian President Leahy posted on social media, accusing Israel of "crossing the red line" and warning that this "may force everyone to take action".

On Monday (October 30), at the end of the Asian Market, Iranian President Leahy posted on social media, accusing Israel of “crossing the red line” and warning that this “may force everyone to take action”. After a significant increase in gold last Friday and breaking the $2000 mark, the Asian market remained volatile, waiting for further guidance from fundamentals. US crude oil fell 134 points at the opening of the Asian market, supported by support at 83.41, with the current price around 84. On November 1, the U.S. Treasury Department will announce its bond issuance plan for the next three months. JPMorgan Chase and Deutsche Bank estimate that the net issuance of treasury bond bonds by the U.S. Treasury Department in the fourth quarter of this year and the first quarter of next year will be about $1.5 trillion. The US dollar index continued to fluctuate at the end of the Asian market, waiting for further fundamental guidance. The current price is around 106.61. In late Asian trading, the yield of Japanese 10-year treasury bond rose to 0.89%, which was the highest level since July 2013. The Nikkei 225 Index closed down 0.95% at 30696.96. USDJPY rose at the opening of the Asian market and was hindered from rising above 149.80. There is currently a risk expectation of the Bank of Japan intervening in the market for USDJPY, and future trading remains cautious. EURUSD has remained volatile in the Asian market today, with downward pressure above 1.0573 and the current price at 1.0558, after being supported and rising at 1.0535 below last Friday.
MHMarkets strategy is only for reference and not for investment advice. Please carefully read the statement at the end of the text. The following strategy will be updated at 15:00 on October 30, Beijing time.
·Gold XAUUSD· | |
Resistance | 2014.78 – 2022.46 |
Support | 1997.25 – 1978.55 – 1971.59 |
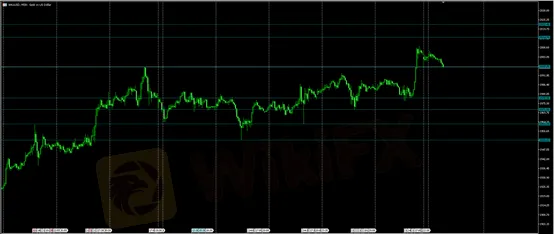 The above figure shows the 30 minute chart of gold. The chart shows that the recent upward resistance of gold has been around 2014.78-2022.46, and the downward support has been around 1997.25-1978.55-1971.59. The market will be judged by whether to break through the upper and lower support and resistance. Note: The above strategy was updated at 15:00 on October 30. This policy is a daytime policy. Please pay attention to the policy release time. | |
· Crude Oil USOUSD· | |
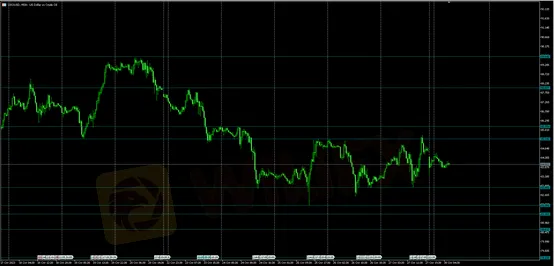
Resistance | 85.34 – 85.99 – 88 |
Support | 82.80 – 81.86 – 81.41 |
 | |
· EURUSD· | |
Resistance | 1.0573 - 1.0597 – 1.0606 |
Support | 1.0535 - 1.0521 – 1.0495 |
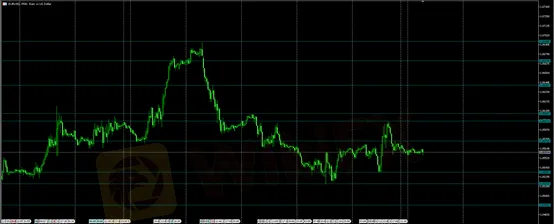 The above figure shows the 30 minute chart of EURUSD. The chart shows that the recent upward resistance of EURUSD is around 1.0573-1.0597-1.0606, and the downward support is around 1.0535-1.0521-1.0495. The market will be judged by whether to break through the upper and lower support and resistance. Note: The above strategy was updated at 15:00 on October 30. This policy is a daytime policy. Please pay attention to the policy release time. | |
· GBPUSD· | |
Resistance | 1.2125 – 1.2153 – 1.2174 |
Support | 1.2104 - 1.2072 – 1.2035 |
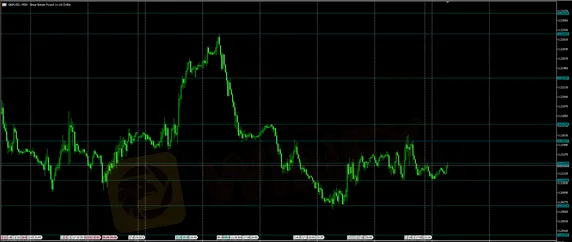 The above figure shows the 30 minute chart of GBPUSD. The chart shows that the recent upward resistance of GBPUSD is around 1.2125-1.2153-1.2174, and the downward support is around1.2104-1.2072-1.2035. The market will be judged by whether to break through the upper and lower support and resistance. Note: The above strategy was updated at 15:00 on October 30. This policy is a daytime policy. Please pay attention to the policy release time. | |

WikiFX Trader
VT Markets
JustMarkets
FOREX.com
Ultima
GTCFX
STARTRADER
VT Markets
JustMarkets
FOREX.com
Ultima
GTCFX
STARTRADER
WikiFX Trader
VT Markets
JustMarkets
FOREX.com
Ultima
GTCFX
STARTRADER
VT Markets
JustMarkets
FOREX.com
Ultima
GTCFX
STARTRADER
Rate Calc


