MHMarkets:Yellen: Market expectations can be a policy complement to the Fed.
Sommario:At the end of the Asian market on Thursday (December 7), US Treasury Secretary Janet Yellen stated on Wednesday that the bond market's expectations for the Fed's rate hikes or cuts may be a "beneficial supplement" to monetary policy, provided that participants are careful when interpreting the upcoming data.

69.87.EURUSD continued to decline yesterday and broke below the support below, ultimately closing near the intraday low. At the opening of the Asian market today, EURUSD fell below yesterday's low and is currently priced around 1.0764. Earlier today, Bank of Japan Governor Kazuo Ueda stated in parliament that the inflation data is far higher than the Bank of Japan's 2% target, but the inflation trend has not yet been anchored above that level. Therefore, the central bank needs to continue to maintain monetary easing policies, and it is still too early to conduct exit simulations. The Bank of Japan plans to provide information before exiting to achieve a smooth transition. USDJPY accelerated its downward trend at the opening today and continuously broke through multiple supports below, with a current price around 146.35.
MHMarkets strategy is only for reference and not for investment advice. Please carefully read the statement at the end of the text. The following strategy will be updated at 15:00 on December 7, Beijing time.
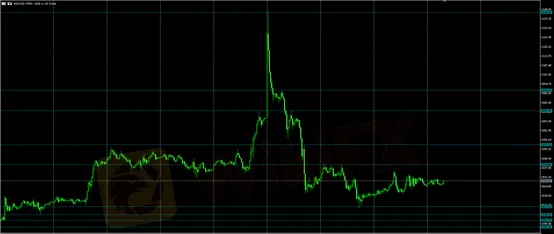
Gold XAUUSD· | |
Resistance | 2039.66 – 2053.33 – 2076.42 |
Support | 2011.15 – 2005.55 – 2001.79 |
 The above figure shows the 30 minute chart of gold. The chart shows that the recent upward resistance of gold has been around 2039.66-2053.33-2076.42, and the downward support has been around 2011.15-2005.55-2001.79. The market will be judged by whether to break through the upper and lower support and resistance. Note: The above strategy was updated at 15:00 on December 7. This policy is a daytime policy. Please pay attention to the policy release time. | |
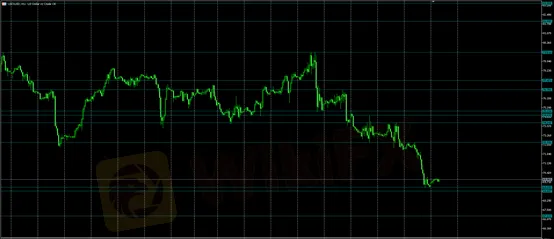
Crude Oil USOUSD· | |
Resistance | 72.73 – 74.24 – 74.81 |
Support | 69.29 – 69 – 67.11 |
 The above chart shows the 30 minute chart of US crude oil. The chart shows that the recent upward resistance of US crude oil is around 72.73-74.24-74.81, and the downward support is around 69.29-69-67.11. The market will be judged by whether to break through the upper and lower support and resistance. Note: The above strategy was updated at 15:00 on December 7. This policy is a daytime policy. Please pay attention to the policy release time. | |
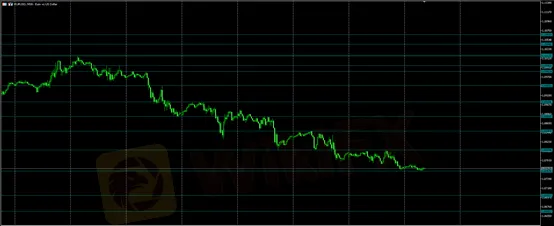
EURUSD· | |
Resistance | 1.0804 - 1.0847 - 1.0880 |
Support | 1.0757 - 1.0701 - 1.0665 |
 The above figure shows the 30 minute chart of EURUSD. The chart shows that the recent upward resistance of EURUSD is around 1.0804-1.0847-1.0880, and the downward support is around 1.0757-1.0701-1.0665. The market will be judged by whether to break through the upper and lower support and resistance. Note: The above strategy was updated at 15:00 on December 7. This policy is a daytime policy. Please pay attention to the policy release time. | |
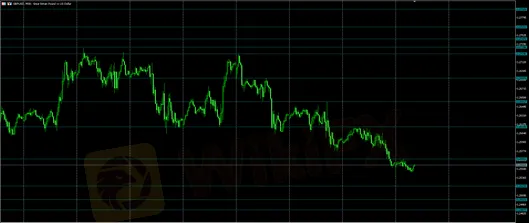
GBPUSD· | |
Resistance | 1.2565 – 1.2613 – 1.2651 |
Support | 1.2523 - 1.2503 – 1.2487 |
 | |

WikiFX Trader
GTCFX
eightcap
HFM
octa
D prime
IC Markets Global
GTCFX
eightcap
HFM
octa
D prime
IC Markets Global
WikiFX Trader
GTCFX
eightcap
HFM
octa
D prime
IC Markets Global
GTCFX
eightcap
HFM
octa
D prime
IC Markets Global
Rate Calc

