Market Focus on Earnings Report
Sommario:As we head into the second quarter earnings report season, the U.S. equity market is poised to capture significant attention. Recent geopolitical events, particularly the unconfirmed reports of an explosion in Iran's third-largest city last Friday, have injected volatility into commodities prices and bolstered the appeal of safe-haven assets like the U.S. dollar and Japanese Yen.
Market Focus on Earnings Report
Downplay of last Friday's explosion in Iran sees commodities prices plummet.
The dollar remains firm above the $106 mark while the U.S. treasury yield continues to climb.
BTC completed its fourth Halving, and BTC prices climbed to above $65000.
Market Summary
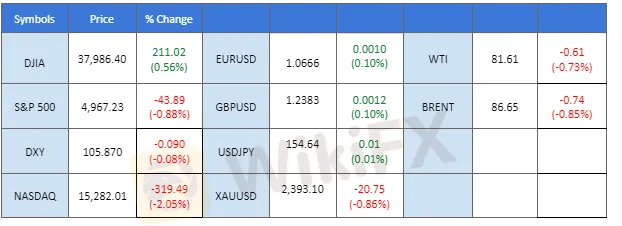
As we head into the second quarter earnings report season, the U.S. equity market is poised to capture significant attention. Recent geopolitical events, particularly the unconfirmed reports of an explosion in Iran's third-largest city last Friday, have injected volatility into commodities prices and bolstered the appeal of safe-haven assets like the U.S. dollar and Japanese Yen. However, the rapid dismissal of these reports by Israeli and Iranian officials led to a swift reversal in these gains. Currently, the Dollar Index is showing signs of struggle, attempting to maintain its position above the $106 mark. Concurrently, the Japanese Yen is facing its own challenges, lingering at its weakest level against the dollar in 34 years.
During periods of geopolitical uncertainty, which generally dampen sentiment towards equity markets, the focus often shifts to corporate earnings as potential catalysts. As such, traders and investors are keenly awaiting the upcoming earnings reports, hoping they might provide the necessary momentum to energise the equity markets despite the broader geopolitical and economic uncertainties.
Current rate hike bets on 1st May Fed interest rate decision:
Source: CME Fedwatch Tool
0 bps (97%) VS -25 bps (3%)
Market Overview
Prices as of 03:00 EET

Economic Calendar
(MT4 System Time)
N/A
Source: MQL5
Market Movements

DOLLAR_INDX, H4
Looking ahead to the coming week, investors are bracing for continued volatility, with a keen eye on not only ongoing Middle East tensions but also key economic data releases, particularly from the US. Of particular interest will be the release of US inflation data, including the Personal Consumption Expenditures (PCE) Price Index, a favoured gauge by the Federal Reserve. Despite recent flatness in the US dollar, a bullish bias persists, fueled by both geopolitical uncertainties and positive economic performance in the US, coupled with hawkish statements from Fed officials.
The Dollar Index is trading lower following the prior retracement from the resistance level. MACD has illustrated increasing bearish momentum, while RSI is at 52, suggesting the index might extend its losses toward support level since the RSI retraced sharply from overbought territory.
Resistance level: 106.35, 107.05
Support level: 105.80, 105.25

XAU/USD, H1
Gold prices, meanwhile, find themselves in a holding pattern, consolidating within a range as investors adopt a cautious stance while monitoring market developments. With the spectre of rising Middle East tensions looming large, coupled with upcoming economic data releases, significant movements in the gold market are anticipated. Investors remain vigilant, poised to react to any signals provided by these events.
Gold prices are trading lower while currently testing the support level. MACD has illustrated increasing bearish momentum, while RSI is at 45, suggesting the commodity might extend its losses after breakout since the RSI says below the midline.
Resistance level: 2395.00, 2415.00
Support level: 2375.00, 2360.00

GBP/USD,H4
The GBP/USD pair's recent trading below its consolidation range indicates a bearish outlook, particularly as the U.S. dollar benefits from heightened demand for safe-haven assets amidst ongoing geopolitical uncertainty. This environment has bolstered the dollar, exerting additional downward pressure on the pair. As traders and investors look ahead, the forthcoming UK Purchasing Managers' Index (PMI) readings will be closely monitored to gauge the strength of the Sterling.
The GBP/USD pair has broken below the consolidation range after a bearish trend suggests the bearish momentum remains strong. The RSI has been hovering at the lower region while the MACD stayed below the zero line, suggesting the pair remain trading with bearish momentum.
Resistance level: 1.2440, 1.2540
Support level: 1.2370, 1.226

EUR/USD,H4
The EUR/USD pair's sideways movement in the context of a strengthening U.S. dollar indicates relative resilience in the euro. Typically, when the dollar strengthens due to its safe-haven appeal amidst geopolitical tensions, it can pressure other major currencies. However, the euro holding steady suggests underlying strength or specific factors supporting it. The upcoming PMI readings from the eurozone will be crucial for providing further clarity on the economic condition of the region as well as the strength of the euro.
After a bearish trend suggests a potential trend reversal signal, EUR/USD forms a higher-high price pattern. The MACD is on the brink of breaking above the zero line while the RSI is climbing higher from the oversold zone.
Resistance level: 1.0700, 1.0775
Support level: 1.0630, 1.0560

USD/JPY,H4
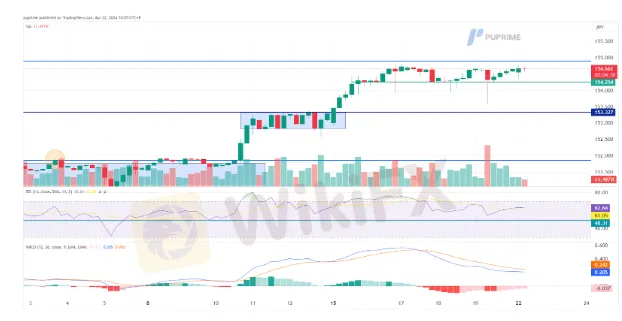
The Japanese yen's persistent weakness against the U.S. dollar, lingering at its lowest level in 34 years, underscores the currency's ongoing struggles. Despite the Bank of Japan (BoJ) scrapping its Yield Curve Control (YCC) earlier this year, the yen has failed to find support, facing substantial selling pressure. Investors and traders closely monitoring the yen's performance are eagerly awaiting Friday's BoJ monetary policy statement. This statement is anticipated to provide valuable insights into the central bank's future policy decisions and their potential impact on the yen's trajectory.
The USD/JPY pair remains in its uptrend trajectory and could potentially break above its current resistance level at 154.75. The RSI has been hovering above 50, while the MACD has eased and is declining, suggesting that the bullish momentum is easing.
Resistance level: 154.90, 156.50
Support level: 153.30, 151.85

Nasdaq, H4
In the realm of equities, rising US Treasury yields and a prevailing risk-off sentiment, exacerbated by ongoing Middle East tensions, weighed heavily on high-risk assets. The Nasdaq Composite endured its longest losing streak in over a year, with market jitters compounded by concerns over geopolitical conflicts and stubborn inflationary pressures. Amidst this backdrop, market participants remain attuned to further developments, navigating a landscape fraught with uncertainty and potential pitfalls.
Nasdaq is trading lower while currently testing the support level. MACD has illustrated increasing bearish momentum. However, RSI is at 24, suggesting the index might enter oversold territory.
Resistance level: 17850.00, 18430.00
Support level: 16975.00, 16230.00

BTC/USD, H4
The completion of Bitcoin's fourth halving event has had a notable impact on its price, propelling BTC to the $65,000 mark. This price movement is in line with historical trends observed around previous halving events, where the reduced rate of new Bitcoin entering circulation tends to create bullish sentiment among investors due to the perceived scarcity of the asset. Additionally, the significant growth in the assets under management (AUM) of BlackRocks iShares Bitcoin Trust, which now exceeds $17 billion, strongly indicates increased institutional interest and confidence in Bitcoin following the halving.
BTC is currently facing strong resistance at near $65000 mark and has formed a higher-high price pattern suggesting a bullish signal for BTC. The RSI has been moving flat while the MACD has broken above the zero line suggesting the bullish momentum is forming.
Resistance level: 64900.00, 67080.00
Support level: 61920.00, 59500.00

CL OIL, H4
Oil prices experienced a roller-coaster last week amidst heightened geopolitical tensions in the Middle East. Initial reports of Iran launching multiple missiles on Israel fueled a surge in bullish momentum, driving prices higher. However, conflicting accounts soon emerged, casting doubt on the authenticity of the reports and leading to a retracement in prices as fears of immediate conflict waned. However, the persistent focus on Middle East tensions continues to influence global investors, keeping oil market volatility elevated.
Oil prices are trading lower following the prior breakout below the previous support level. MACD has illustrated increasing bearish momentum, while RSI is at 39, suggesting the commodity might extend its losses toward support level since the RSI stays below the midline.
Resistance level: 82.85, 84.65
Support level: 80.45, 78.00
WikiFX Trader
ATFX
Pepperstone
FOREX.com
Neex
STARTRADER
OANDA
ATFX
Pepperstone
FOREX.com
Neex
STARTRADER
OANDA
WikiFX Trader
ATFX
Pepperstone
FOREX.com
Neex
STARTRADER
OANDA
ATFX
Pepperstone
FOREX.com
Neex
STARTRADER
OANDA
Rate Calc

