Gold Nears Exhaustion as Dollar Strength Looms
Sommario:On the 15th, the United States released its November Producer Price Index (PPI) and Retail Sales data simultaneously. Overall, PPI did not show signs of a meaningful reacceleration, while retail sales
On the 15th, the United States released its November Producer Price Index (PPI) and Retail Sales data simultaneously. Overall, PPI did not show signs of a meaningful reacceleration, while retail sales remained resilient. Together, these data points reinforced market confidence in the near-term growth outlook of the U.S. economy.
In addition, both the U.S. trade deficit and fiscal deficit have continued to narrow, suggesting that the U.S. dollar index is likely to benefit from improving twin deficits and trend stronger in the foreseeable future.
Under Chair Powells tenure, aggressive rate cuts remain unlikely. However, looking ahead to the second half of the year, a potential change in Federal Reserve leadership could remove structural constraints on the easing cycle, paving the way for a renewed “Goldilocks” economic environment.
Investors should remain cautious. While precious metals have surged amid strong bullish sentiment, the potential for U.S. dollar appreciation suggests that current gold price strength may already be approaching its limits.
PPI Shows Contained Inflation Pressures
U.S. November PPI rose 0.2% month-over-month, in line with market expectations. A closer look at the breakdown shows that final demand goods prices surged 0.9% MoM, marking the strongest monthly increase since 2024, primarily driven by rising energy prices. Fortunately, final demand services prices were flat, helping to cap the overall PPI reading.
From a structural perspective, final demand trade services margins declined 0.8%, indicating that wholesalers and retailers absorbed part of the rising input costs by compressing profit margins. As a result, goods inflation has not been fully passed on to consumers, providing clear evidence that December CPI inflation may continue to cool.
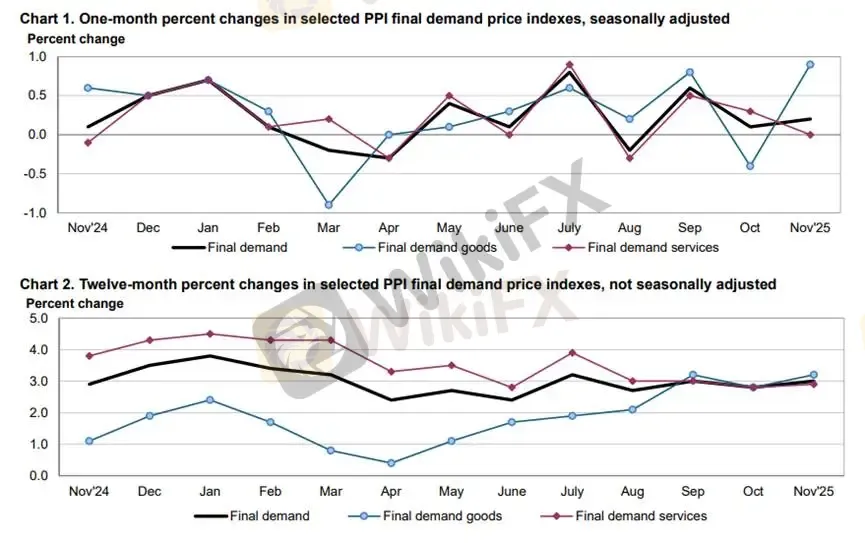
(Figure 1: U.S. Producer Price Index – November | Source: BLS)
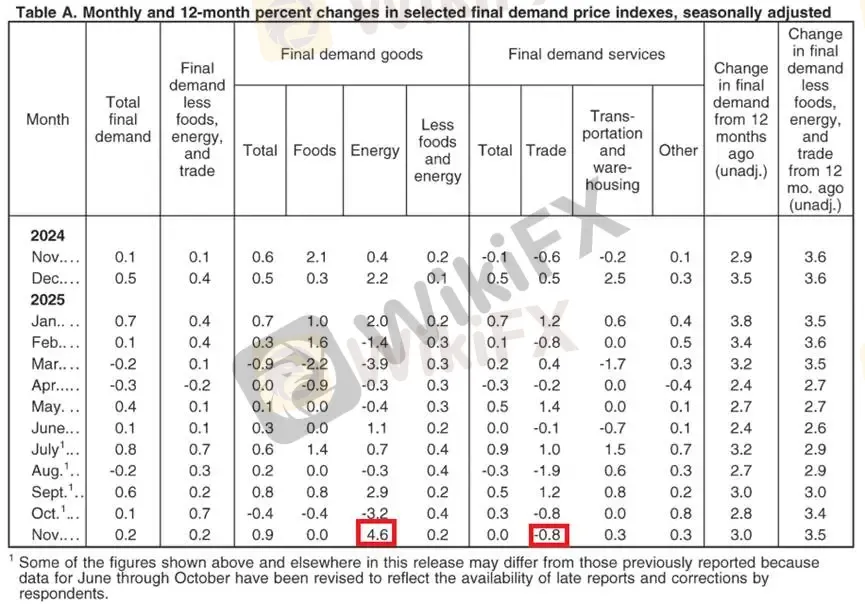
(Figure 2: PPI Components Breakdown | Source: BLS)Retail Sales Beat Expectations, But Growth Remains Modest
November U.S. retail sales came in above market expectations. However, this upside surprise was largely driven by overly pessimistic forecasts, rather than a genuine acceleration in end-demand. After adjusting for inflation, real retail sales increased by 0.6%, only a modest gain compared with last years traditional peak season.

(Figure 3: Real Retail Sales | Source: FRED)Inventory Rebuilding Cycle Continues
Business inventory data aligned with our earlier projections. The inventory replenishment cycle showed an inflection point in September and continued to expand in October as companies rebuilt inventories ahead of the seasonal peak.
The inventory-to-sales ratio failed to improve meaningfully, rising alongside inventories to 1.38, with accumulation concentrated primarily among wholesalers (midstream) and retailers (downstream).
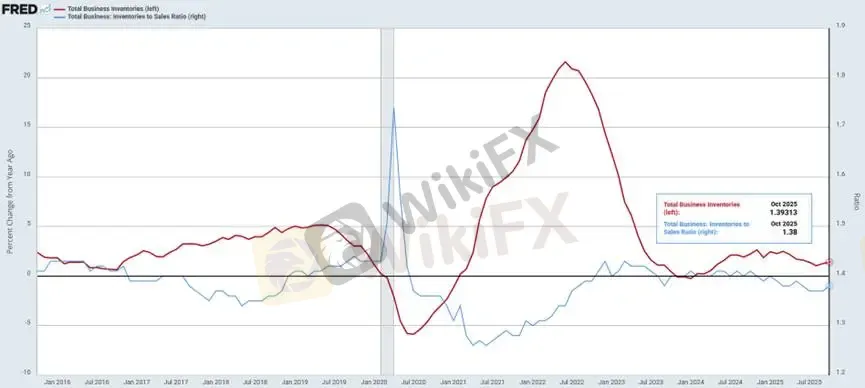
(Figure 4: U.S. Business Inventories & Inventory-to-Sales Ratio – October | Source: FRED)
With end-demand growing only moderately, these data do not support a more aggressive Fed rate-cut trajectory. This, in turn, reduces the downside risk for the U.S. dollar index in the first half of the year.
Twin Deficit Improvement Supports the Dollar
The U.S. twin deficit problem has persisted for over a decade. However, tariff policies and manufacturing reshoring initiatives under Trumps administration have significantly improved fiscal conditions. By Q4 2025, the fiscal deficit narrowed by USD 110 billion year-over-year, representing a 16% reduction.
As shown in Figure 5, structural improvement in the trade and fiscal balances has historically been followed by a strong rebound in the U.S. dollar (highlighted by the purple box). This reinforces our cautious stance on the sustainability of the recent surge in precious metals.
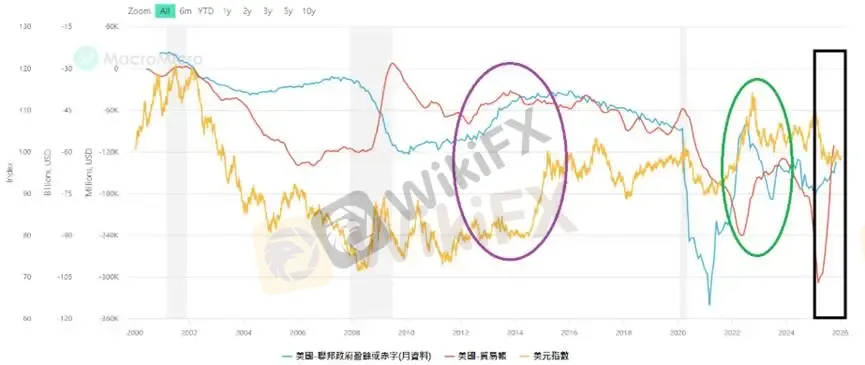
(Figure 5: Improvement in U.S. Twin Deficits | Source: MacroMicro)
Gold Technical Analysis

The blue ascending channel, drawn from the November 17, 2025 low, represents the medium-term uptrend. Meanwhile, the orange ascending channel, drawn from the December 30, 2025 low, reflects the short-term uptrend. Price has now reached the upper boundary of both channels. From a momentum standpoint, this suggests an elevated risk of a near-term pullback.
The MACD oscillator shows narrowing histogram bars oscillating around the zero line. Despite continued price advances, momentum indicators are diverging from price action, signaling weakening upside momentum.
At this stage, attempting to short at the top offers limited risk-reward efficiency. The preferred strategy is to remain on the sidelines. For bullish pullbacks, key support should be monitored at the Fibonacci 38.2% and 50% retracement levels.
Risk Disclaimer
The views, analyses, research, price levels, and other information provided above are for general market commentary only and do not represent the position of this platform. All readers assume full responsibility for their own risks. Please trade with caution.

WikiFX Trader
EBC FINANCIAL GROUP
EC markets
STARTRADER
D prime
vantage
FOREX.com
EBC FINANCIAL GROUP
EC markets
STARTRADER
D prime
vantage
FOREX.com
WikiFX Trader
EBC FINANCIAL GROUP
EC markets
STARTRADER
D prime
vantage
FOREX.com
EBC FINANCIAL GROUP
EC markets
STARTRADER
D prime
vantage
FOREX.com
Rate Calc

