2021-04-02 09:43
相場分析Theta Price Prediction:
関連商品:
外国為替,その他,その他,その他,その他,その他
相場分析:
Theta Price Prediction: THETA beginning a deep correction
CRYPTOS | 4/2/2021 12:27:39 AM GMT
Share on Twitter Share on Facebook Share on Linkedin
Theta price last reached five standard deviations above the mean last week.
Historical precedent projects a decline of at least 45%.
10-week simple moving average (SMA) has stabilized price declines in the past.
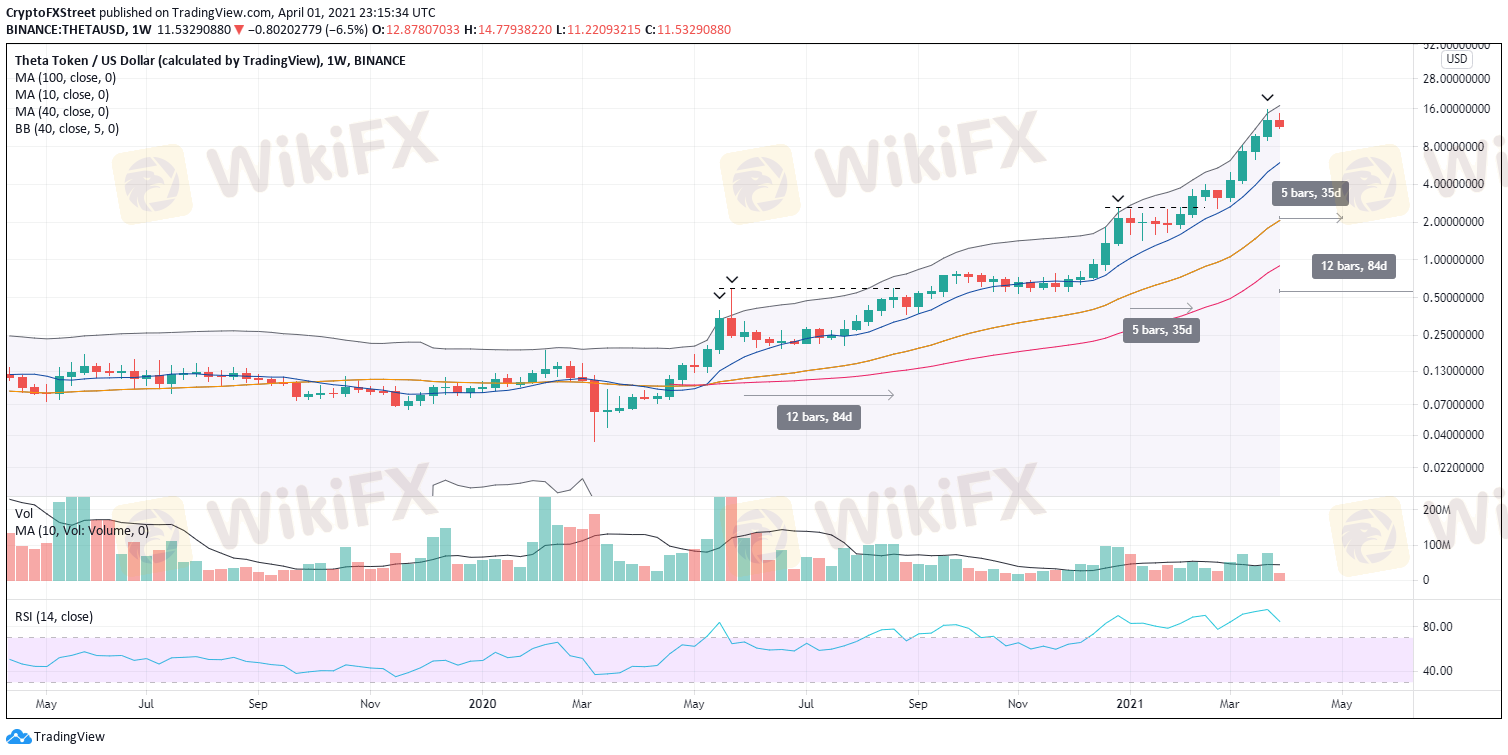
Theta price engineered a remarkable advance of 44,160% from the March 2020 low to the March high. What makes it even more impressive is that the price has found constant support at or around the 10-week SMA since April 2020. Additionally, THETA traded five standard deviations (StdDEV) above the mean (40-week SMA) in March, putting traders on alert that a correction was near.
Theta price climbed 290% in March
Measuring the distance from the price to a moving average is a valuable tool to identify periods of extreme deviation that the naked eye can’t always pick up. In the case of THETA, the digital token has exceeded five standard deviations from the 40-week SMA just four weeks since the March 2020 low, including last week.
In May 2020, THETA reached more than five standard deviations above the mean for two straight weeks. The other time this occurred was in December 2020. In May, the altcoin crashed 65% but did find support at the 10-week SMA. Later in December, THETA dropped almost 45% but bottomed above the 10-week SMA.
Based on the previous percentages and averaging out the two to equal 55%, THETA could fall to $7.06, basically a decline of 40% from price at the time of writing. A test of the 10-week SMA would be an almost 50% decline from the current price and 60% from the March high.
Rey
المتداول
人気の話題
業界
米国株式や日経などのクロスボーダー ETF は大量に高値で償還され
業界
包括的なリスク管理計画を策定する
業界
高度なテクノロジーとテクニカル分析を活用する
業界
📢2025年1月9日11:00の通貨ペア
業界
危険】:米国でVarna Tradeを訪問しましたが、オフィスは見つかりませんでした‼ 詳細は下の画
業界
👀#WikiFX 「先週、日本人ユーザーが最も検索されたFX会社が発表されました!」
市場分類

会社ナビ

エキスポ

IB

募集

EA

業界

相場

指標
Theta Price Prediction:
 フィリピン | 2021-04-02 09:43
Theta Price Prediction: THETA beginning a deep correction
CRYPTOS | 4/2/2021 12:27:39 AM GMT
Share on Twitter Share on Facebook Share on Linkedin
Theta price last reached five standard deviations above the mean last week.
Historical precedent projects a decline of at least 45%.
10-week simple moving average (SMA) has stabilized price declines in the past.
Theta price engineered a remarkable advance of 44,160% from the March 2020 low to the March high. What makes it even more impressive is that the price has found constant support at or around the 10-week SMA since April 2020. Additionally, THETA traded five standard deviations (StdDEV) above the mean (40-week SMA) in March, putting traders on alert that a correction was near.
Theta price climbed 290% in March
Measuring the distance from the price to a moving average is a valuable tool to identify periods of extreme deviation that the naked eye can’t always pick up. In the case of THETA, the digital token has exceeded five standard deviations from the 40-week SMA just four weeks since the March 2020 low, including last week.
In May 2020, THETA reached more than five standard deviations above the mean for two straight weeks. The other time this occurred was in December 2020. In May, the altcoin crashed 65% but did find support at the 10-week SMA. Later in December, THETA dropped almost 45% but bottomed above the 10-week SMA.
Based on the previous percentages and averaging out the two to equal 55%, THETA could fall to $7.06, basically a decline of 40% from price at the time of writing. A test of the 10-week SMA would be an almost 50% decline from the current price and 60% from the March high.
外国為替
その他
その他
その他
その他
その他
いいね 0
私もコメントします
質問します
0コメント件数

誰もまだコメントしていません、すぐにコメントします

質問します
誰もまだコメントしていません、すぐにコメントします