
2020-04-18 15:25
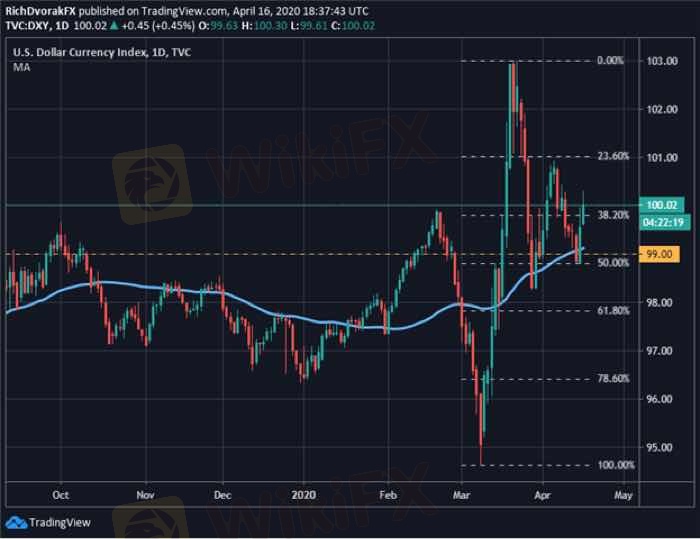
テクニカル指標US DOLLAR – DXY INDEX PRICE CHART: DAILY TIME FRAM
Also, the DXY Index appears to have found technical support around the 99.00 price level, which is highlighted by the confluence of its 50-day simple moving average, October 2019 swing high, and mid-point retracement of last month’s bullish leg. From a fundamental perspective, the latest coronavirus developments have likely rekindled demand for safe-haven currencies and US Dollar dominance. Specifically, investor risk appetite soured on the back of news that several countries are prolonging their coronavirus lockdown.
いいね 0

TPKNX
ผู้ประกอบการ
人気の話題
業界
米国株式や日経などのクロスボーダー ETF は大量に高値で償還され
業界
包括的なリスク管理計画を策定する
業界
高度なテクノロジーとテクニカル分析を活用する
業界
📢2025年1月9日11:00の通貨ペア
業界
危険】:米国でVarna Tradeを訪問しましたが、オフィスは見つかりませんでした‼ 詳細は下の画
業界
👀#WikiFX 「先週、日本人ユーザーが最も検索されたFX会社が発表されました!」
市場分類

会社ナビ

エキスポ

IB

募集

EA

業界

相場

指標
US DOLLAR – DXY INDEX PRICE CHART: DAILY TIME FRAM
アメリカ合衆国 | 2020-04-18 15:25いいね 0
私もコメントします
質問します
0コメント件数

誰もまだコメントしていません、すぐにコメントします
質問します
誰もまだコメントしていません、すぐにコメントします