2020-05-06 09:42
テクニカル指標GVZ (GOLD VOLATILITY) TECHNICAL ANALYSIS: DAILY PR
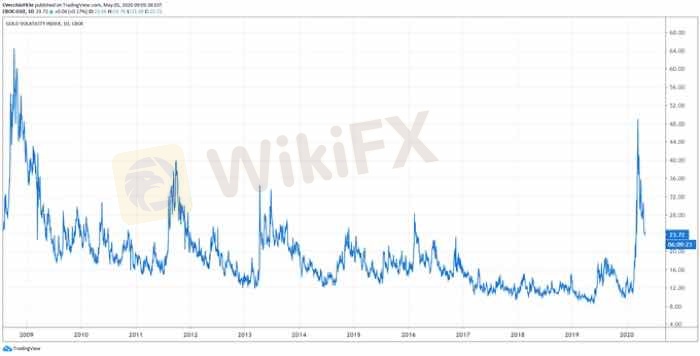
Gold volatility (as measured by the Cboe’s gold volatility ETF, GVZ, which tracks the 1-month implied volatility of gold as derived from the GLD option chain) is trading at 23.72, breaking its coronavirus pandemic low set on March 16 at 23.96. It’s worth noting that, despite gold volatility breaking its coronavirus pandemic lows, gold prices have not: gold prices were trading at 1696.94 at the time this report was written; on March 16, gold prices traded as low as 1451.43.
As such, the 5-day correlation between GVZ and gold prices is 0.08 while the 20-day correlation is -0.41; one week ago, on April 28, the 5-day correlation was 0.68 and the 20-day correlation was -0.43; and one month ago, on April 7, the 5-day correlation was 0.99 and the 20-day correlation was -0.55.
It remains the case that, as has occurred many times over the past year, when gold volatility falls but gold prices do not follow, leading to a situation of negative correlations in the short-term, it has typically indicated a digestion period for the market prior to further gains. If history is a guide, the recent sideways move in gold prices in context of the decline in gold volatility may be setting up the conditions for a rally after all.
いいね 1

TPKNX
Participants
人気の話題
業界
米国株式や日経などのクロスボーダー ETF は大量に高値で償還され
業界
包括的なリスク管理計画を策定する
業界
高度なテクノロジーとテクニカル分析を活用する
業界
📢2025年1月9日11:00の通貨ペア
業界
危険】:米国でVarna Tradeを訪問しましたが、オフィスは見つかりませんでした‼ 詳細は下の画
業界
👀#WikiFX 「先週、日本人ユーザーが最も検索されたFX会社が発表されました!」
市場分類

会社ナビ

エキスポ

IB

募集

EA

業界

相場

指標


質問します
誰もまだコメントしていません、すぐにコメントします