2024-12-23 13:41
業界2⃣Doji (Market Indecision) 🤔
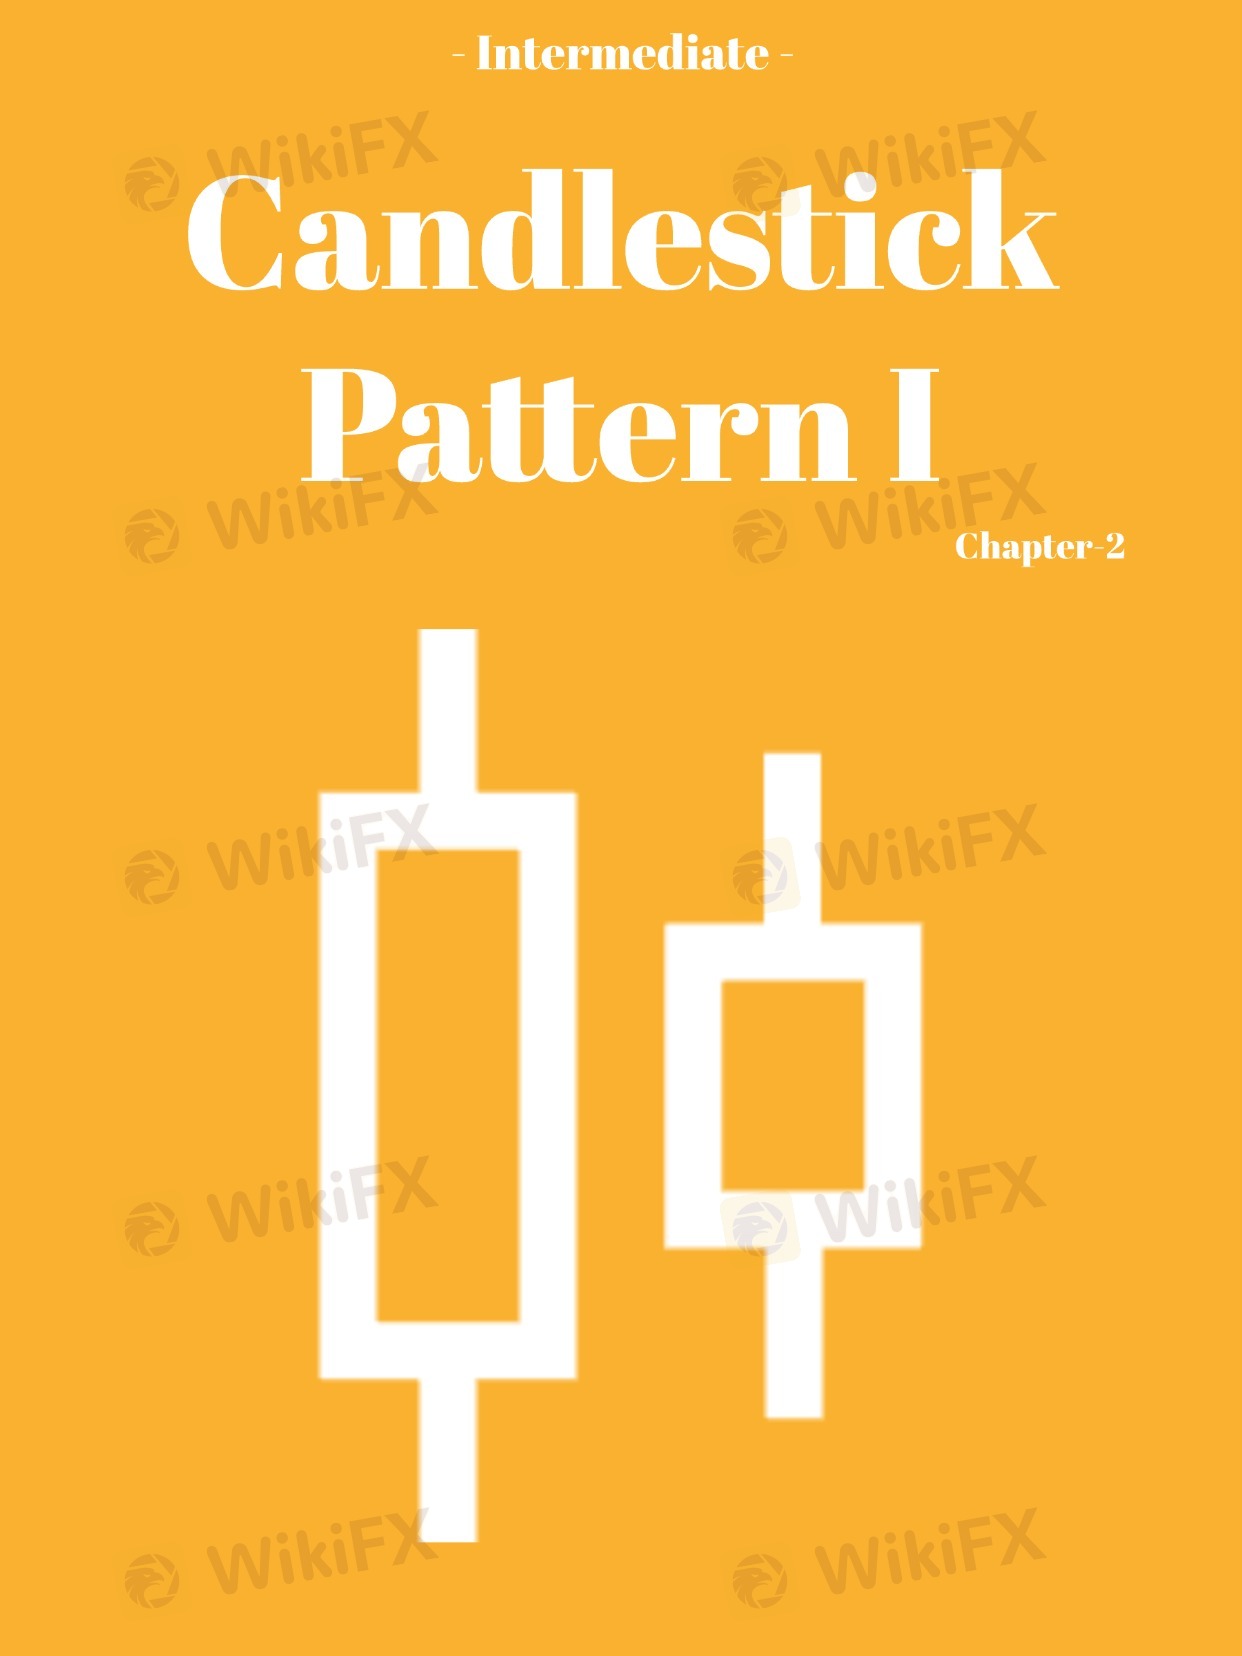
The Doji candlestick is a small body with long wicks, where the opening and closing prices are nearly the same.
This pattern shows that neither buyers nor sellers have control, and the market is in a state of indecision.
Key Point: The Doji by itself is neutral, but it’s often a signal that the current trend may be losing momentum.
The significance of the Doji increases when it occurs after a strong trend, indicating a potential reversal.
Example: After a strong uptrend, a Doji might indicate that the bullish momentum is fading, and the market could be preparing for a reversal.
Conversely, after a downtrend, a Doji could signal that selling pressure is weakening, and the market may start moving upwards.
いいね 0

人気の話題
業界
米国株式や日経などのクロスボーダー ETF は大量に高値で償還され
業界
包括的なリスク管理計画を策定する
業界
高度なテクノロジーとテクニカル分析を活用する
市場分類

会社ナビ

エキスポ

IB

募集

EA

業界

相場

指標
2⃣Doji (Market Indecision) 🤔
 香港 | 2024-12-23 13:41
The Doji candlestick is a small body with long wicks, where the opening and closing prices are nearly the same.
This pattern shows that neither buyers nor sellers have control, and the market is in a state of indecision.
Key Point: The Doji by itself is neutral, but it’s often a signal that the current trend may be losing momentum.
The significance of the Doji increases when it occurs after a strong trend, indicating a potential reversal.
Example: After a strong uptrend, a Doji might indicate that the bullish momentum is fading, and the market could be preparing for a reversal.
Conversely, after a downtrend, a Doji could signal that selling pressure is weakening, and the market may start moving upwards.
いいね 0
私もコメントします
質問します
0コメント件数

誰もまだコメントしていません、すぐにコメントします

質問します
誰もまだコメントしていません、すぐにコメントします