
2025-01-29 02:16
業界Candlestick trading
#firstdealofthenewyearchewbacca#
Candlestick trading is a popular method of analyzing and predicting market price movements in financial markets such as stocks, forex, and cryptocurrencies. It uses candlestick charts, which visually represent price data over a specific time frame. Each candlestick provides four key pieces of information:
1. Open: The price at which the asset started trading during the time period.
2. High: The highest price reached during the time period.
3. Low: The lowest price reached during the time period.
4. Close: The price at which the asset ended trading during the time period.
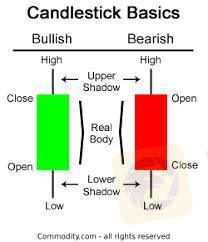
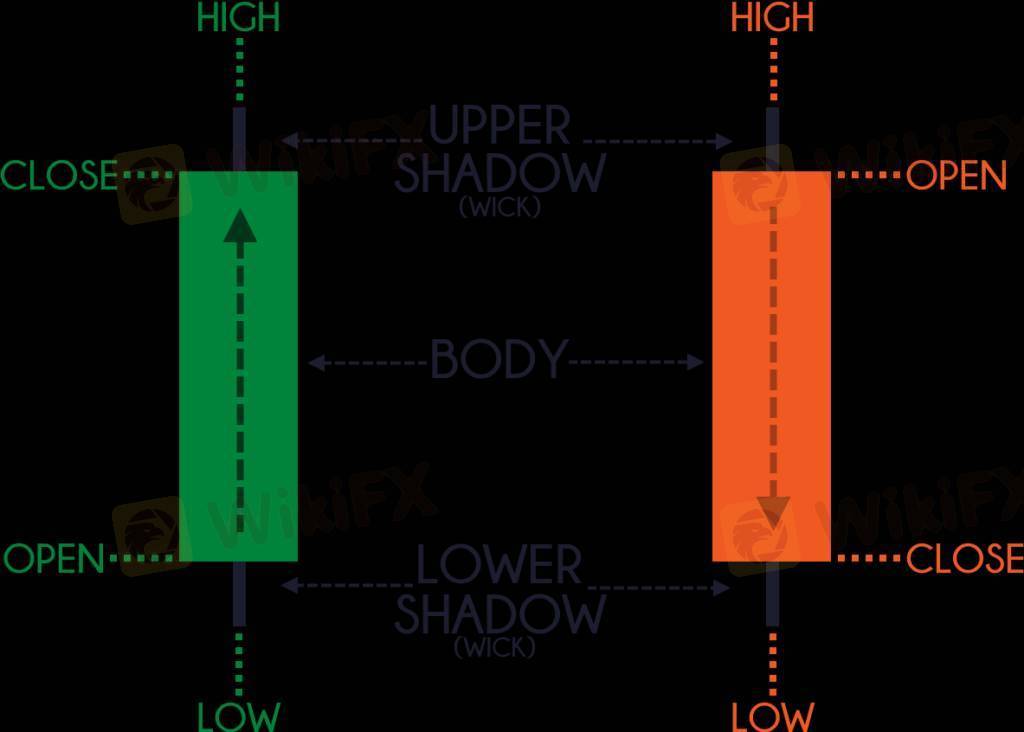
Components of a Candlestick
Body: The rectangular part of the candlestick represents the difference between the opening and closing prices.
Bullish Candle: If the closing price is higher than the opening price, the candle is typically green or white.
Bearish Candle: If the closing price is lower than the opening price, the candle is typically red or black.
Wicks/Shadows: The thin lines above and below the body show the high and low prices during the time period.
Common Candlestick Patterns
Candlestick patterns are categorized into reversal patterns and continuation patterns. Here are a few examples:
Reversal Patterns
1. Hammer: A small body near the top with a long lower wick, signaling potential bullish reversal.
2. Shooting Star: A small body near the bottom with a long upper wick, signaling potential bearish reversal.
3. Engulfing Pattern:
Bullish Engulfing: A small red candle followed by a larger green candle that "engulfs" the previous one.
Bearish Engulfing: A small green candle followed by a larger red candle that "engulfs" the previous one.
Continuation Patterns
1. Doji: A candle where the open and close prices are nearly the same, indicating indecision in the market.
2. Morning Star: A three-candle pattern signaling a bullish continuation.
3. Evening Star: A three-candle pattern signaling a bearish continuation.
Advantages of Candlestick Trading
Easy to read and interpret visually.
Provides insights into market sentiment.
Works well with other technical indicators (e.g., moving averages, RSI).
Limitations
Requires practice to interpret correctly.
Patterns may not always predict price movement accurately.
Works best when combined with other tools and analysis methods.
いいね 0

FX1816125491
ブローカー
人気の話題
業界
米国株式や日経などのクロスボーダー ETF は大量に高値で償還され
業界
包括的なリスク管理計画を策定する
業界
高度なテクノロジーとテクニカル分析を活用する
業界
📢2025年1月9日11:00の通貨ペア
業界
危険】:米国でVarna Tradeを訪問しましたが、オフィスは見つかりませんでした‼ 詳細は下の画
業界
👀#WikiFX 「先週、日本人ユーザーが最も検索されたFX会社が発表されました!」
市場分類

会社ナビ

エキスポ

IB

募集

EA

業界

相場

指標
Candlestick trading
ナイジェリア | 2025-01-29 02:16#firstdealofthenewyearchewbacca#
Candlestick trading is a popular method of analyzing and predicting market price movements in financial markets such as stocks, forex, and cryptocurrencies. It uses candlestick charts, which visually represent price data over a specific time frame. Each candlestick provides four key pieces of information:
1. Open: The price at which the asset started trading during the time period.
2. High: The highest price reached during the time period.
3. Low: The lowest price reached during the time period.
4. Close: The price at which the asset ended trading during the time period.
Components of a Candlestick
Body: The rectangular part of the candlestick represents the difference between the opening and closing prices.
Bullish Candle: If the closing price is higher than the opening price, the candle is typically green or white.
Bearish Candle: If the closing price is lower than the opening price, the candle is typically red or black.
Wicks/Shadows: The thin lines above and below the body show the high and low prices during the time period.
Common Candlestick Patterns
Candlestick patterns are categorized into reversal patterns and continuation patterns. Here are a few examples:
Reversal Patterns
1. Hammer: A small body near the top with a long lower wick, signaling potential bullish reversal.
2. Shooting Star: A small body near the bottom with a long upper wick, signaling potential bearish reversal.
3. Engulfing Pattern:
Bullish Engulfing: A small red candle followed by a larger green candle that "engulfs" the previous one.
Bearish Engulfing: A small green candle followed by a larger red candle that "engulfs" the previous one.
Continuation Patterns
1. Doji: A candle where the open and close prices are nearly the same, indicating indecision in the market.
2. Morning Star: A three-candle pattern signaling a bullish continuation.
3. Evening Star: A three-candle pattern signaling a bearish continuation.
Advantages of Candlestick Trading
Easy to read and interpret visually.
Provides insights into market sentiment.
Works well with other technical indicators (e.g., moving averages, RSI).
Limitations
Requires practice to interpret correctly.
Patterns may not always predict price movement accurately.
Works best when combined with other tools and analysis methods.
いいね 0
私もコメントします
質問します
0コメント件数

誰もまだコメントしていません、すぐにコメントします
質問します
誰もまだコメントしていません、すぐにコメントします