
2025-02-06 15:30
業界Trading with Elliott Wave Theory
#firstdealofthenewyearFateema
Elliott Wave Theory (EWT) is a powerful technical analysis tool used in trading to predict market movements by identifying repeating wave patterns. Developed by Ralph Nelson Elliott in the 1930s, the theory suggests that financial markets move in fractal patterns based on investor psychology.
Basic Structure of Elliott Wave Theory
Elliott Wave Theory divides price movements into two main phases:
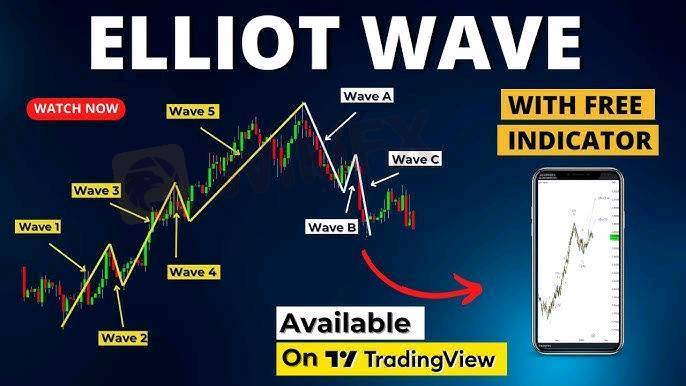
1. Impulse Waves (5-Wave Pattern)
These waves move in the direction of the main trend.
Consists of five waves:
Wave 1: Initial move in the direction of the trend.
Wave 2: Retracement but not beyond the start of Wave 1.
Wave 3: Strongest and longest wave (often extends).
Wave 4: Shallow correction, often sideways.
Wave 5: Final wave in the trend, completing the move.
2. Corrective Waves (3-Wave Pattern)
These waves move against the main trend.
Consists of three waves:
Wave A: Initial move against the trend.
Wave B: Temporary retracement.
Wave C: Final move completing the correction.
Elliott Wave Trading Strategies
1. Identifying the Trend (Impulse Wave Trading)
Enter during Wave 2 pullback or Wave 4 correction.
Ride Wave 3 (strongest move) for maximum profit.
Use Fibonacci retracements to identify entry points.
2. Trading the Correction (Counter-Trend Trading)
Identify corrective patterns (Zigzag, Flat, Triangle).
Short-sell at the end of Wave B or enter long at the end of Wave C.
3. Using Fibonacci for Confirmation
Wave 2 often retraces 50%-61.8% of Wave 1.
Wave 3 often extends 161.8% of Wave 1.
Wave 4 retraces 23.6%-38.2% of Wave 3.
Wave 5 can extend 61.8%-100% of Wave 1-3.
Best Indicators to Use with Elliott Wave
Fibonacci Retracement/Extension (for price targets)
RSI (Relative Strength Index) (divergence at Wave 5)
MACD (Moving Average Convergence Divergence) (momentum confirmation)
Volume (higher in Wave 3, lower in Wave 4)
Challenges in Elliott Wave Trading
Requires experience in wave counting.
Market structure can be subjective.
Works best in trending markets.
Would you like me to analyze a specific chart or asset using Elliott Wave Theory?
いいね 0

Aniema30
ブローカー
人気の話題
業界
米国株式や日経などのクロスボーダー ETF は大量に高値で償還され
業界
包括的なリスク管理計画を策定する
業界
高度なテクノロジーとテクニカル分析を活用する
業界
📢2025年1月9日11:00の通貨ペア
業界
危険】:米国でVarna Tradeを訪問しましたが、オフィスは見つかりませんでした‼ 詳細は下の画
業界
👀#WikiFX 「先週、日本人ユーザーが最も検索されたFX会社が発表されました!」
市場分類

会社ナビ

エキスポ

IB

募集

EA

業界

相場

指標
Trading with Elliott Wave Theory
ナイジェリア | 2025-02-06 15:30#firstdealofthenewyearFateema
Elliott Wave Theory (EWT) is a powerful technical analysis tool used in trading to predict market movements by identifying repeating wave patterns. Developed by Ralph Nelson Elliott in the 1930s, the theory suggests that financial markets move in fractal patterns based on investor psychology.
Basic Structure of Elliott Wave Theory
Elliott Wave Theory divides price movements into two main phases:
1. Impulse Waves (5-Wave Pattern)
These waves move in the direction of the main trend.
Consists of five waves:
Wave 1: Initial move in the direction of the trend.
Wave 2: Retracement but not beyond the start of Wave 1.
Wave 3: Strongest and longest wave (often extends).
Wave 4: Shallow correction, often sideways.
Wave 5: Final wave in the trend, completing the move.
2. Corrective Waves (3-Wave Pattern)
These waves move against the main trend.
Consists of three waves:
Wave A: Initial move against the trend.
Wave B: Temporary retracement.
Wave C: Final move completing the correction.
Elliott Wave Trading Strategies
1. Identifying the Trend (Impulse Wave Trading)
Enter during Wave 2 pullback or Wave 4 correction.
Ride Wave 3 (strongest move) for maximum profit.
Use Fibonacci retracements to identify entry points.
2. Trading the Correction (Counter-Trend Trading)
Identify corrective patterns (Zigzag, Flat, Triangle).
Short-sell at the end of Wave B or enter long at the end of Wave C.
3. Using Fibonacci for Confirmation
Wave 2 often retraces 50%-61.8% of Wave 1.
Wave 3 often extends 161.8% of Wave 1.
Wave 4 retraces 23.6%-38.2% of Wave 3.
Wave 5 can extend 61.8%-100% of Wave 1-3.
Best Indicators to Use with Elliott Wave
Fibonacci Retracement/Extension (for price targets)
RSI (Relative Strength Index) (divergence at Wave 5)
MACD (Moving Average Convergence Divergence) (momentum confirmation)
Volume (higher in Wave 3, lower in Wave 4)
Challenges in Elliott Wave Trading
Requires experience in wave counting.
Market structure can be subjective.
Works best in trending markets.
Would you like me to analyze a specific chart or asset using Elliott Wave Theory?
いいね 0
私もコメントします
質問します
0コメント件数

誰もまだコメントしていません、すぐにコメントします
質問します
誰もまだコメントしていません、すぐにコメントします